Nowadays, test automation is an essential part of the software development process. For effective test automation, it is crucial to build a QA metrics dashboard.
But firstly, we have to complete some prerequisites.
Preconditions
1. Build a testing pyramid for the project.
Specify the number of tests at each level that are planned to be automated and those that are already automated to understand the coverage. For example, we can have the following suggested groups: A, B, C.
A - the most critical tests that we would like to automate with 80% coverage.
B - we work on these tests as a second priority, aiming for 60% coverage.
C - we expect 20% coverage.
It is important to appropriately mark test cases in the project management tool (for example, Jira, Rally, Gitlab, Trello) - what is planned to be automated, and what is already ‘In progress’.
2. Add attributes to test cases.
You can use attributes to specify the area to which the test cases belong to, for example, 'component: UI'. Additionally, attributes can indicate the scope of these tests, such as 'label: smoke'. In the attributes you can also specify the environment where the tests are run, as well as the branch, plugins, and third-party systems. When the same scope of test cases is executed against different environments, versions, or with different plugins, it is beneficial to indicate these differences in the attributes.
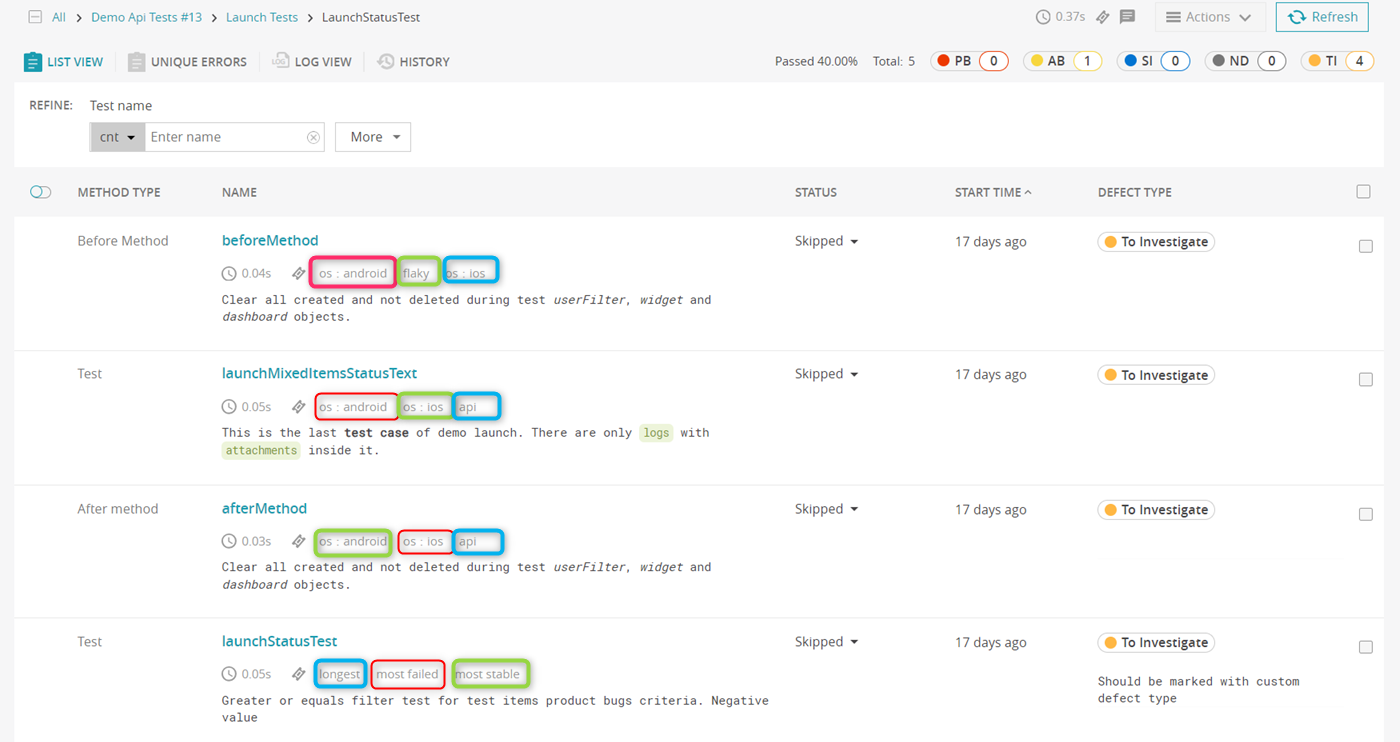
So, we have completed the preconditions, and now we are ready to create the test automation results dashboard. We recommend creating different dashboards for various purposes: for regression testing, for specific versions, for unstable tests, etc. Through collaborative dashboards in test reporting, teams can work together on analyzing test outcomes, identifying weak spots, and improving test coverage more efficiently.
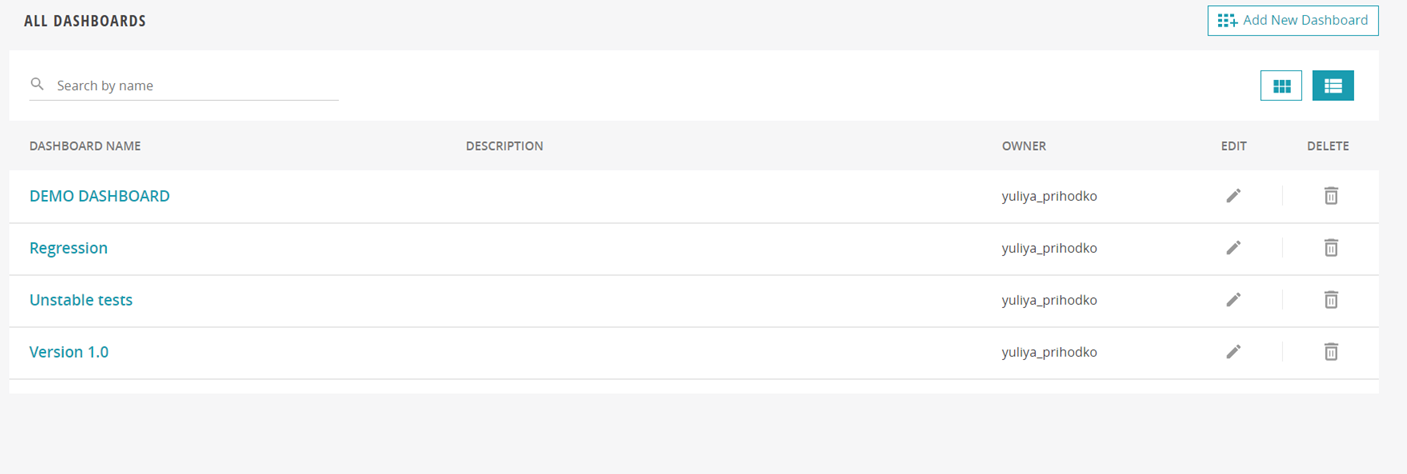
In ReportPortal, you can track test automation metrics using our widgets.
Widgets for tracking test automation
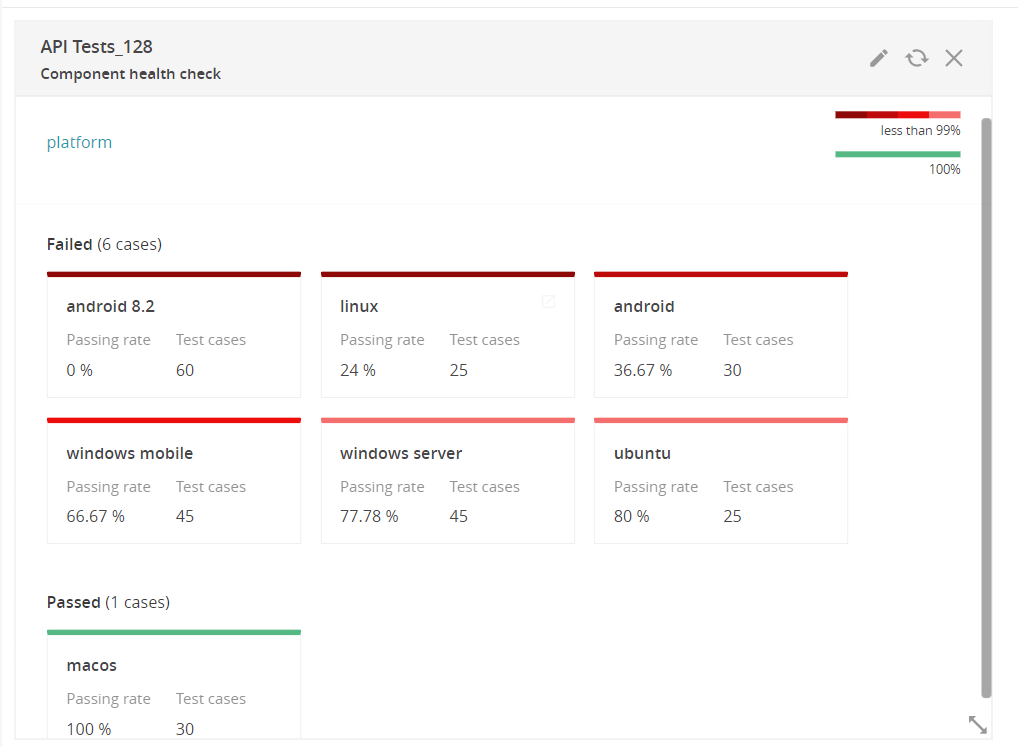
Component Health Check
You can create this widget using attributes and see which components, functionality, platforms, etc. are not working correctly so you should pay more attention to them.
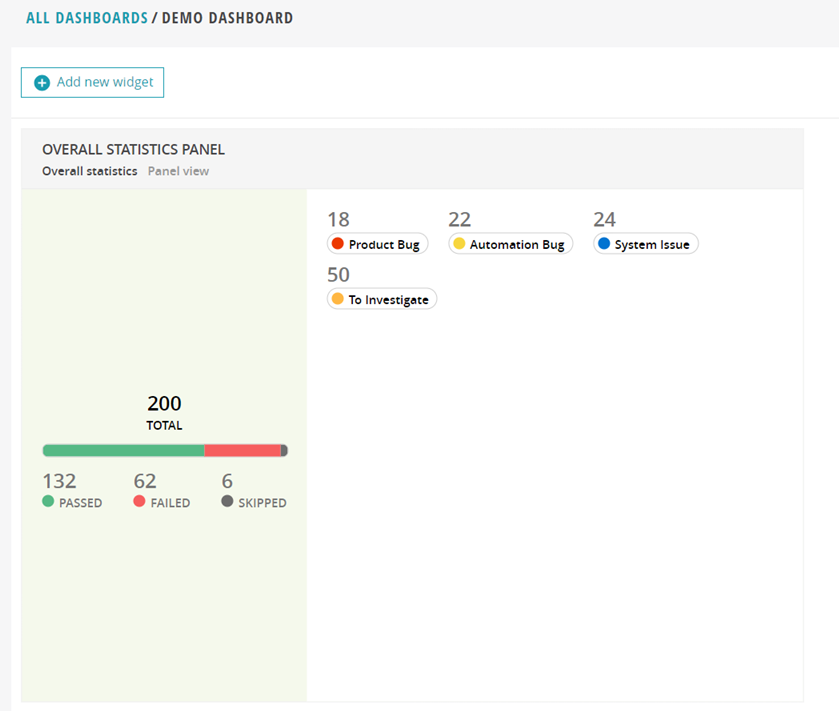
Overall Statistics
This is a summary of test cases with their statuses. In the test result report, you can only set Total/Passed/Failed/Skipped. Additionally, this widget shows the number of bugs categorized by defect type: Product bugs, Automation bugs, and System issues or custom defect types. The widget has clickable sections, allowing you to navigate and view test failures and their causes. Afterward, post an issue in the bug tracking system (BTS) for all Product and Automation bugs or link the already created tickets to the failed items in ReportPortal.
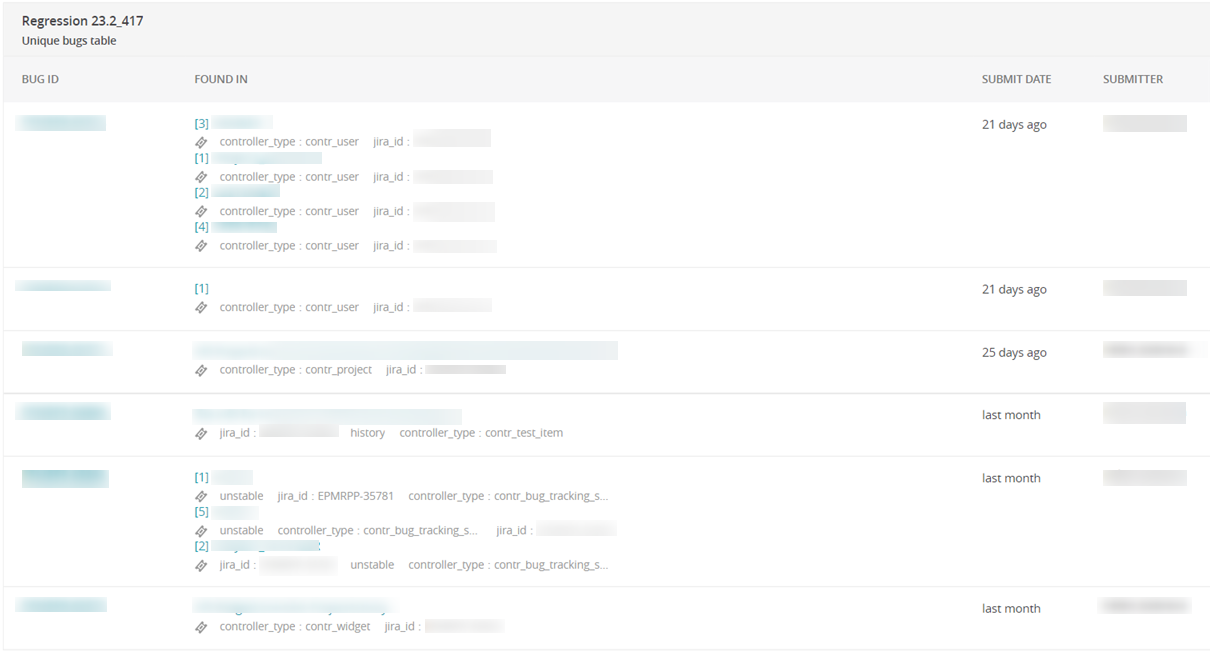
Unique Bugs Table
This widget displays existing bugs created in the BTS. It enables us to track the issues within our product.
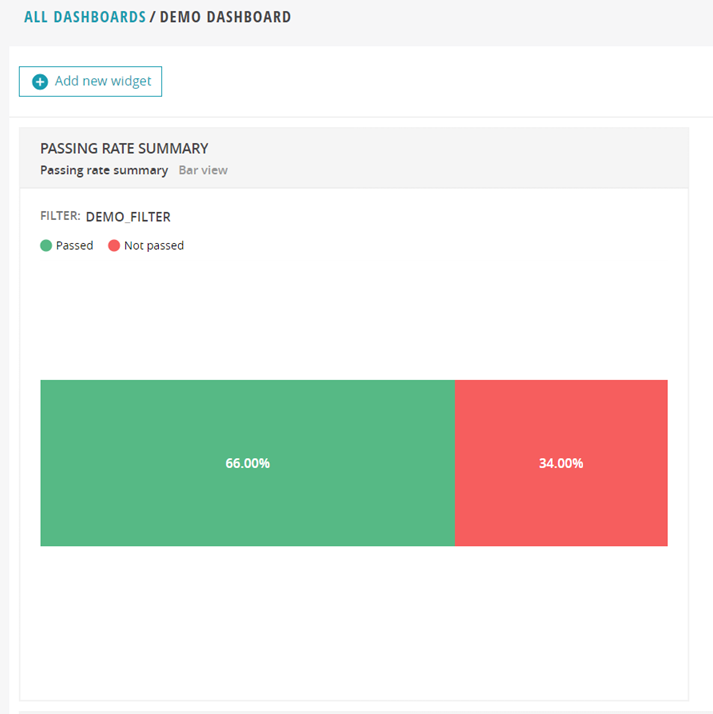
Passing Rate Summary
Initially, it is sufficient to understand the proportion of Passed/Failed cases.
Here, you need to pay attention to the failures: are there any tests that are constantly failing and that don’t yet have a defect type?
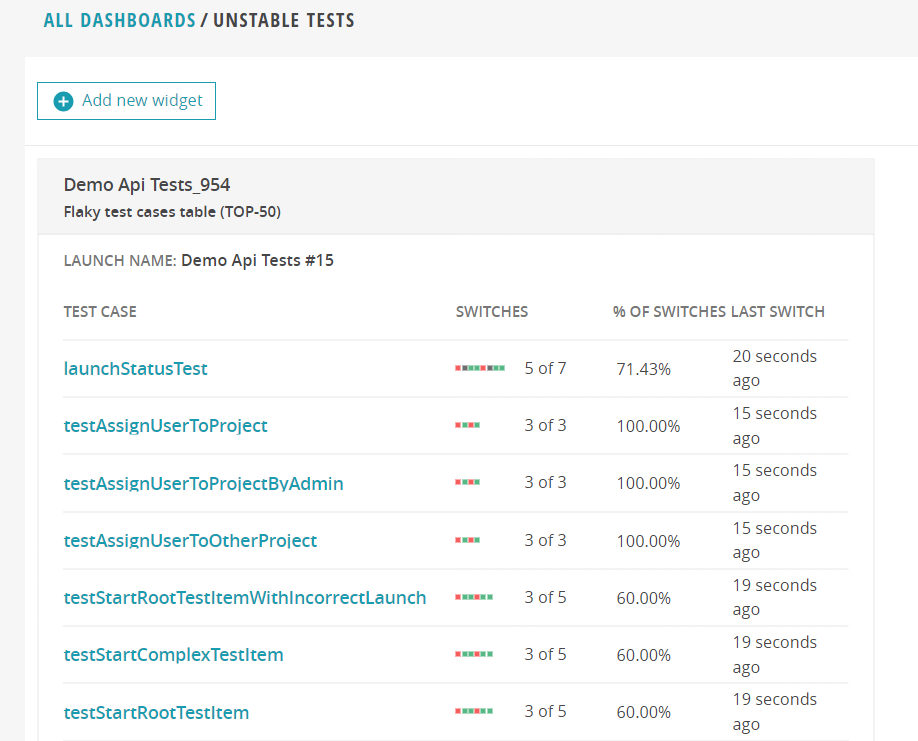
Flaky test cases table
The widget displays the most unstable tests.
It's not just a failure when we know, for example, that it's an automation bug. But if a test first passed, then failed, and then passed again, it means the issue is either in the test itself or in the environment. We need to investigate everything we see here.
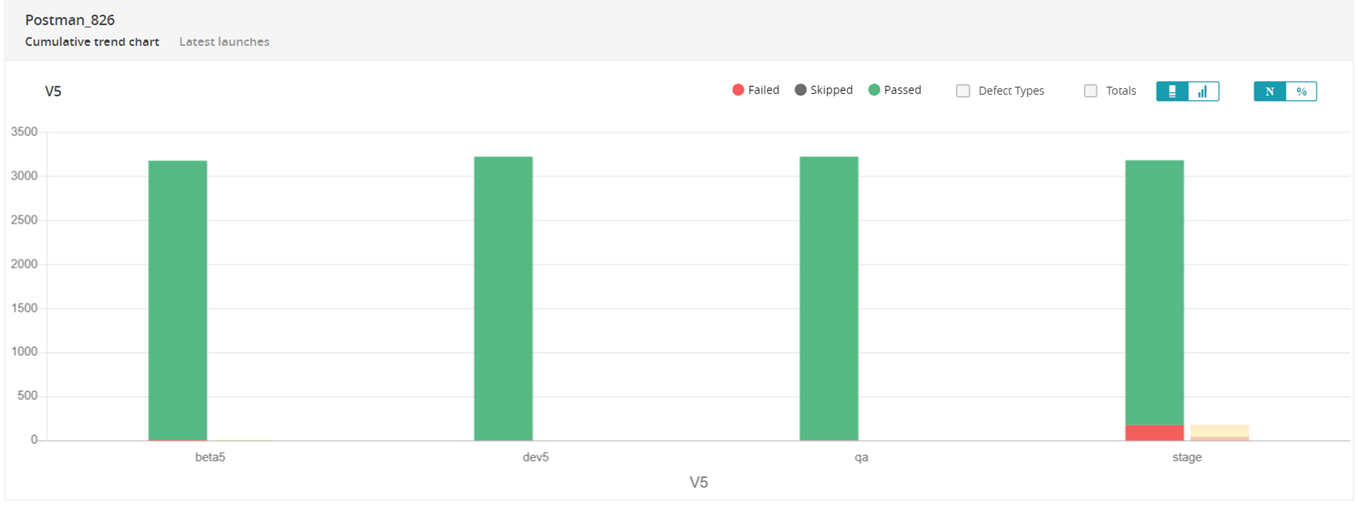
Cumulative trend chart
You only need to build it once to obtain launch summary statistics with one attribute. For example, if we have an 'environment: dev' attribute, it's convenient to view statistics for this environment.
In the ReportPortal, there's a peculiar feature: if a launch has a certain attribute, and there are no attributes at the step level, then all tests within that launch are associated with that attribute.
Therefore, if we have an 'environment: dev' attribute, the system treats all tests within that launch as if they also have this attribute.
In summary, test automation metrics help to enhance test automation, and as a result, contribute to the creation of high-quality software.