ReportPortal is a one-stop solution to manage all your automation results and reports in one place. In this article our QA engineers shared their advice on how to use all ReportPortal capabilities to reduce test results analysis efforts and get pure visibility about product's health.
Let’s walk through the main ways you can optimize your use of ReportPortal: 1. Use hierarchy in tests 2. Use Test Case ID attribute 3. Choose the relevant Launch name 4. Use attributes properly 5. Configure reporting tests via CI/CD 6. Search for the similar "To investigate" items 7. Use Analyzer and ML suggestions 8. Use Unique Errors Analysis 9. Integrate ReportPortal with BTS 10. Use custom defect types 11. Send manual tests in ReportPortal 12. Create widgets 13. Use notifications 14. Use Quality Gates
1. Use hierarchy in tests
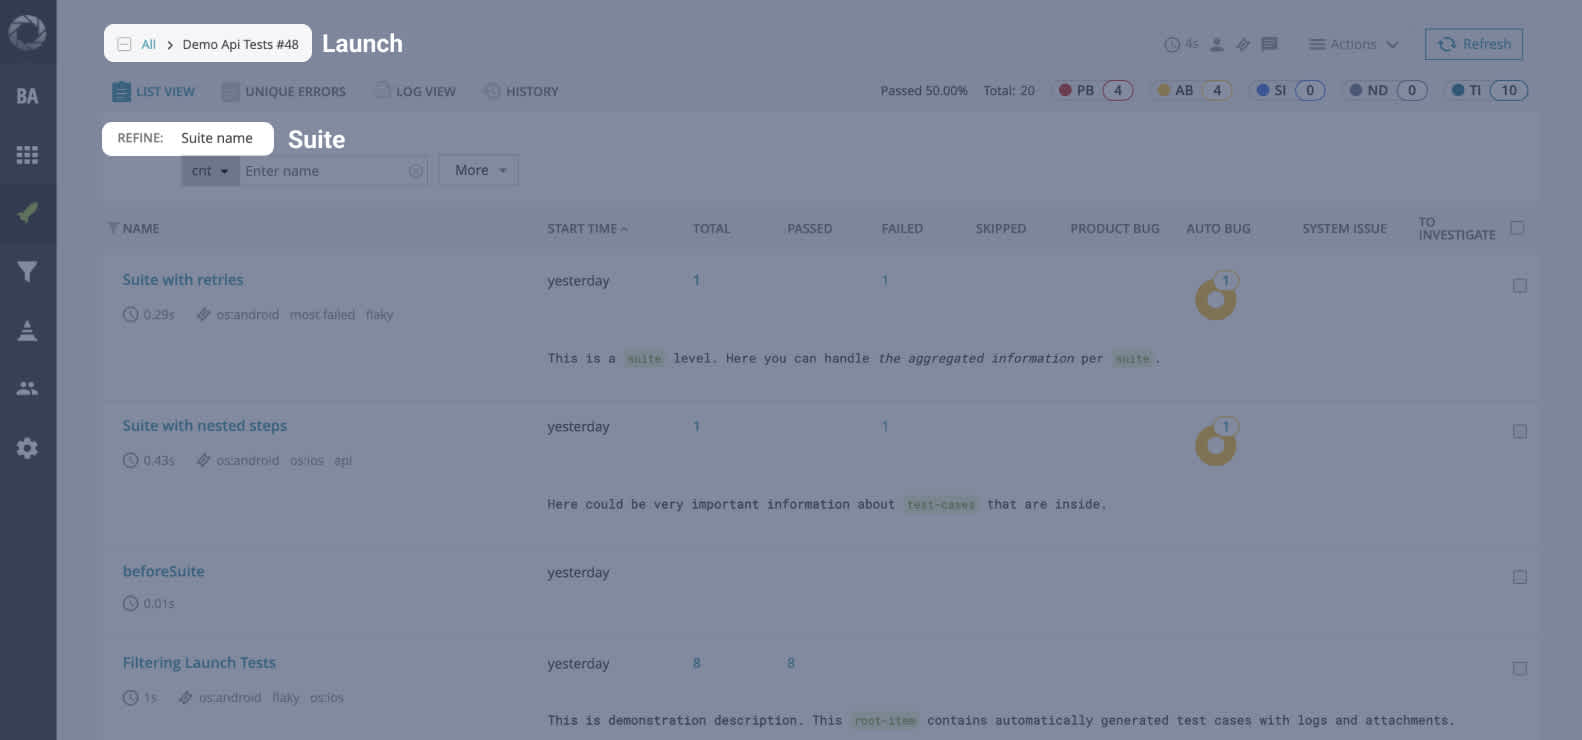
You can run your tests on the Launch level only. But in this way, it's hard to understand what they refer to. Because all of them will have the same type.
Our advice is to use the next hierarchy in your tests in ReportPortal: Launch – Suite – Test – Step. For example, you can distribute your tests by areas using Suite level. Thus, it will be easy to recognize what functionality the failed tests belong to.
2. Use Test Case ID attribute
The best way to distinguish test cases one from another is a Test CaseID. This is a fundamental attribute for the test case history and re-tries. If there is no Test CaseID defined explicitly the ReportPortal agent will generate it based on Code-Reference and parameters. Explicitly Test Case ID can be added programmatically in code, via attributes: TestCaseID.
3. Choose the relevant Launch name
If you are running different types of tests (Unit, API, UI), specify this in the Launch name. Thus, it will be clear for the whole team: what is this Launch used for?
4. Use attributes properly
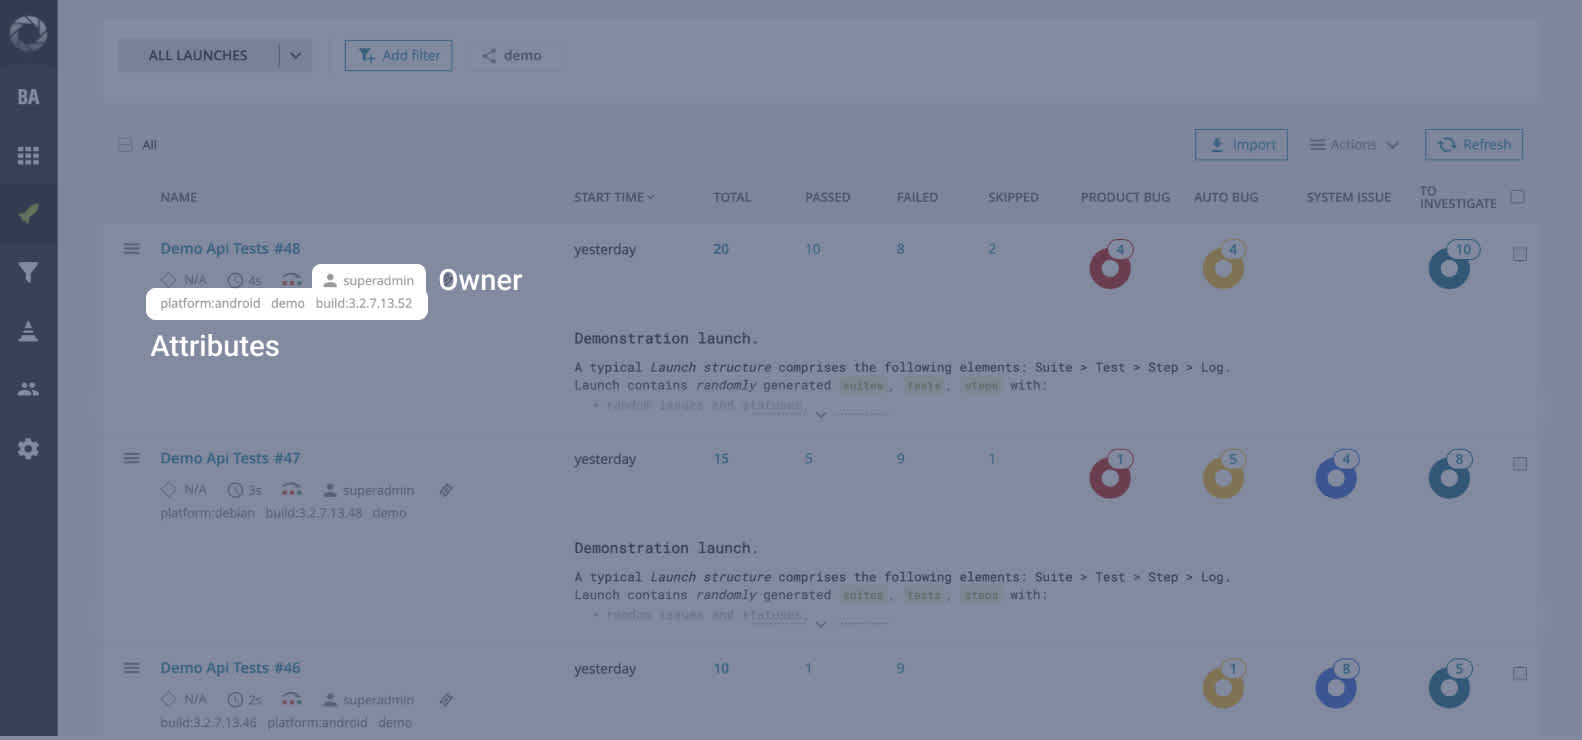
You can describe the environment or version using attributes. What is more, you can filter test executions by these attributes.
Sometimes users define the owner of the launch via attributes as well. But we recommend another way: when running tests, use the Access token of the person who is responsible for this launch (it can be copied from the Profile page in ReportPortal). So, the specified user's name will be displayed as the owner.
5. Configure reporting tests via CI/CD
You can run tests locally. But the best practice is reporting tests to ReportPortal via CI/CD pipeline (for example, Jenkins).
This way the whole team can run tests and view the results.
6. Search for the similar "To investigate" items
Most often you can see several "To investigate" items when reviewing the test results of the first run in ReportPortal. There are a few tips to make the test failure analysis easier.
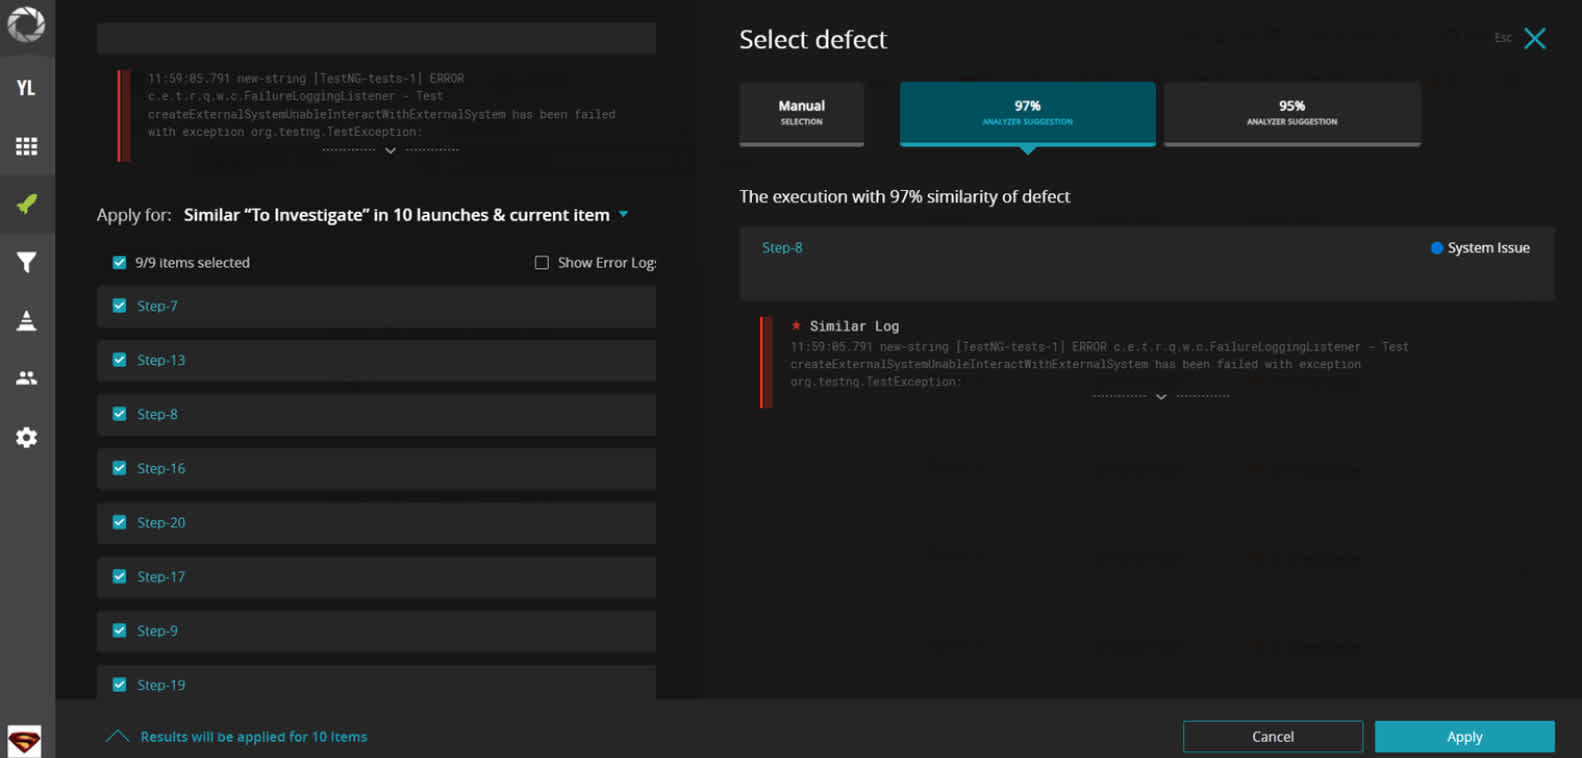
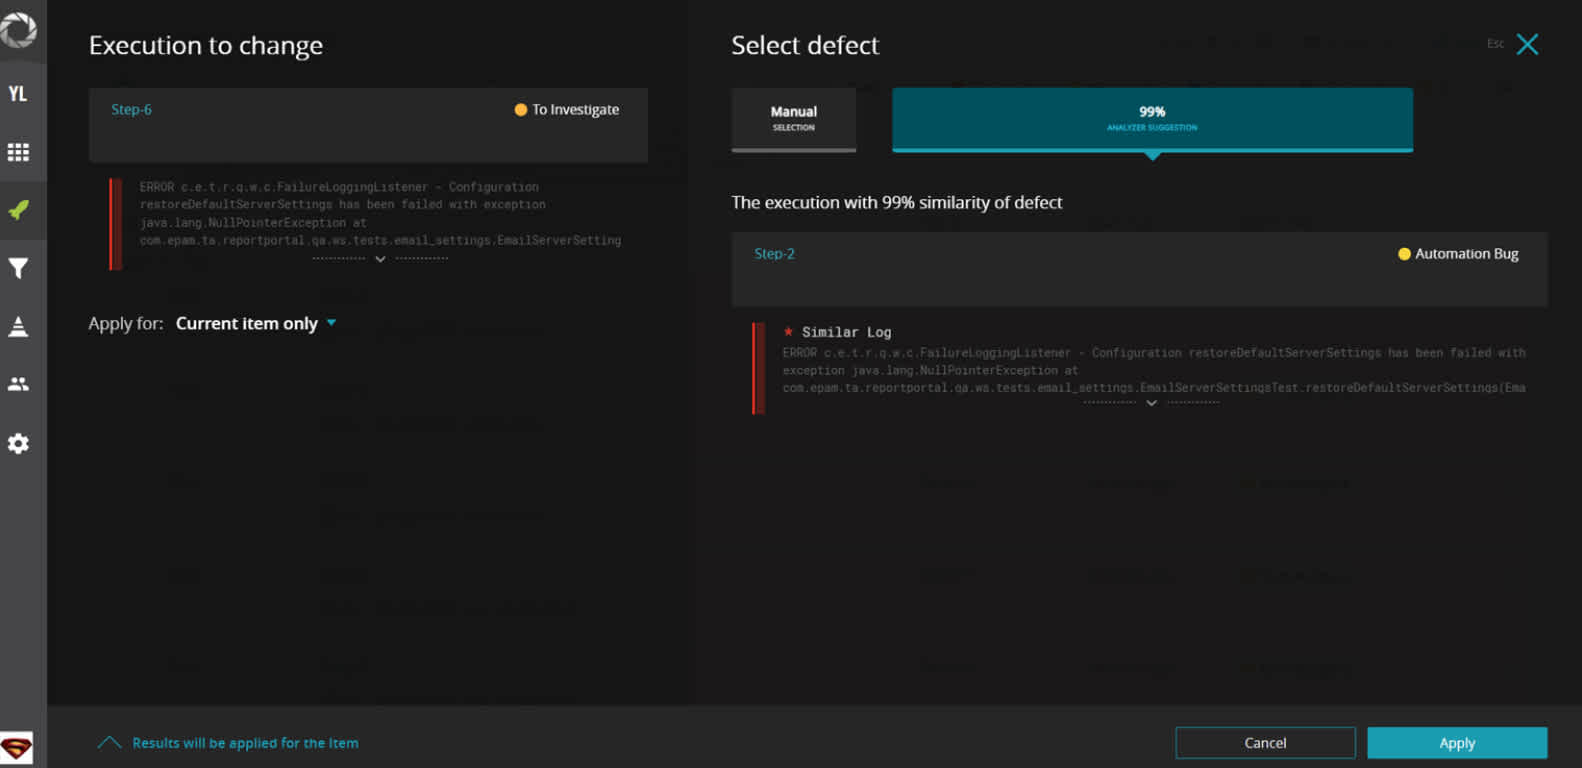
Open "Make Decision" modal for an item with "To investigate", wait for "Apply for..." section to be fully displayed. Now you can see all the similar "To investigate" items. You can select all identical failures and perform the bulk operation for them. It speeds up test results analysis noticeably.
7. Use Analyzer and ML suggestions
You can delegate a part of the routine duties to the Analyzer. For example, you have 100+ failed tests. You can open every test and explore every test log to find the reason for failure. But it will take a long time.
As an alternative, you can run Auto-Analysis. Analyzer will find all known issues and will link corresponding defects based on your previous investigation results. After that, you only have to check (like a controller) whether everything was found by Analyzer.
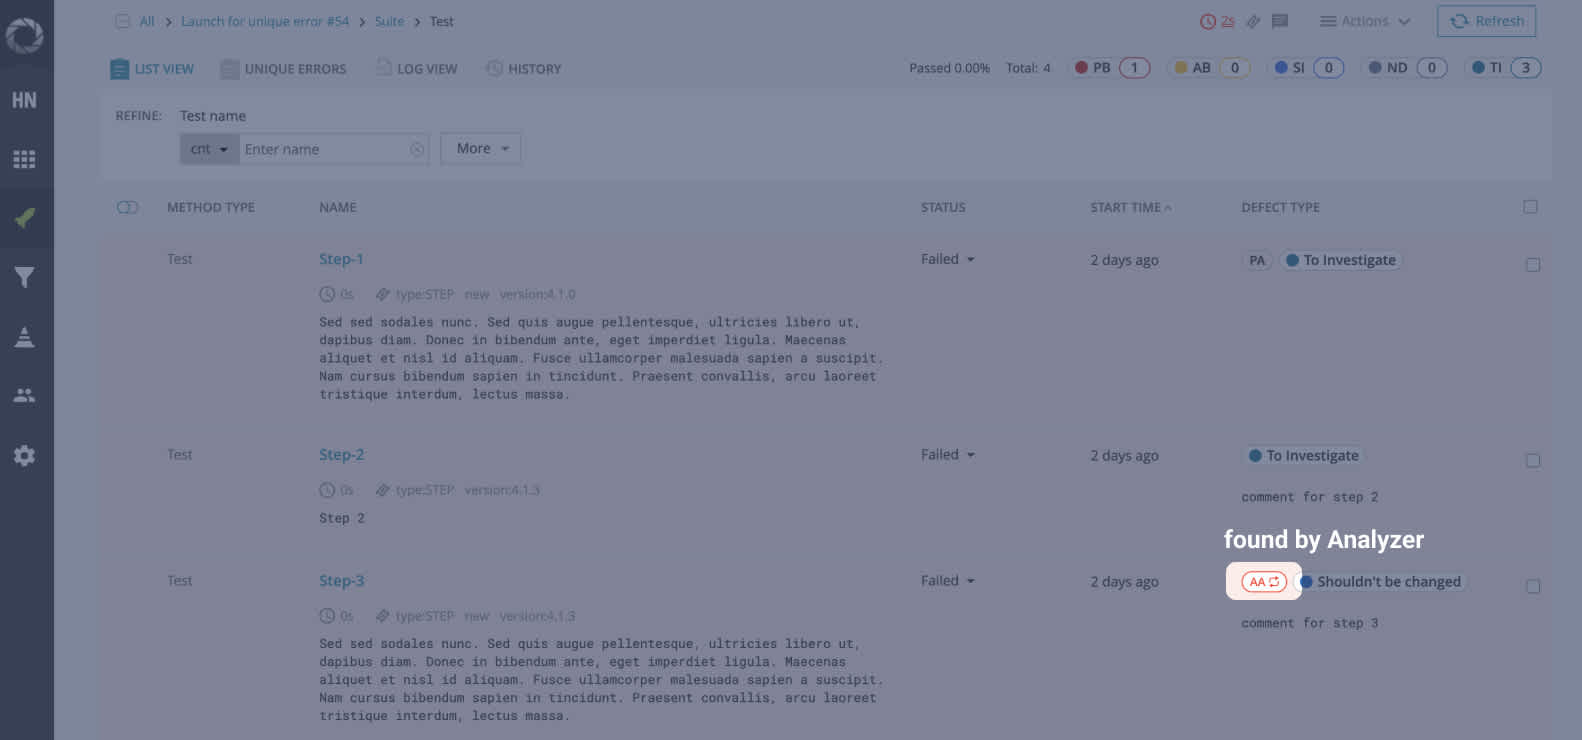
If there are still some "To investigate" items left, just open "Make Decision" modal and look at the ML Suggestions. This functionality suggests the best options to categorize issues. It is a real time-saver for testers.
Note: Auto-Analysis and ML suggestions are useful in subsequent runs only after you do manual defect analysis in the first runs.
8. Use Unique Errors Analysis
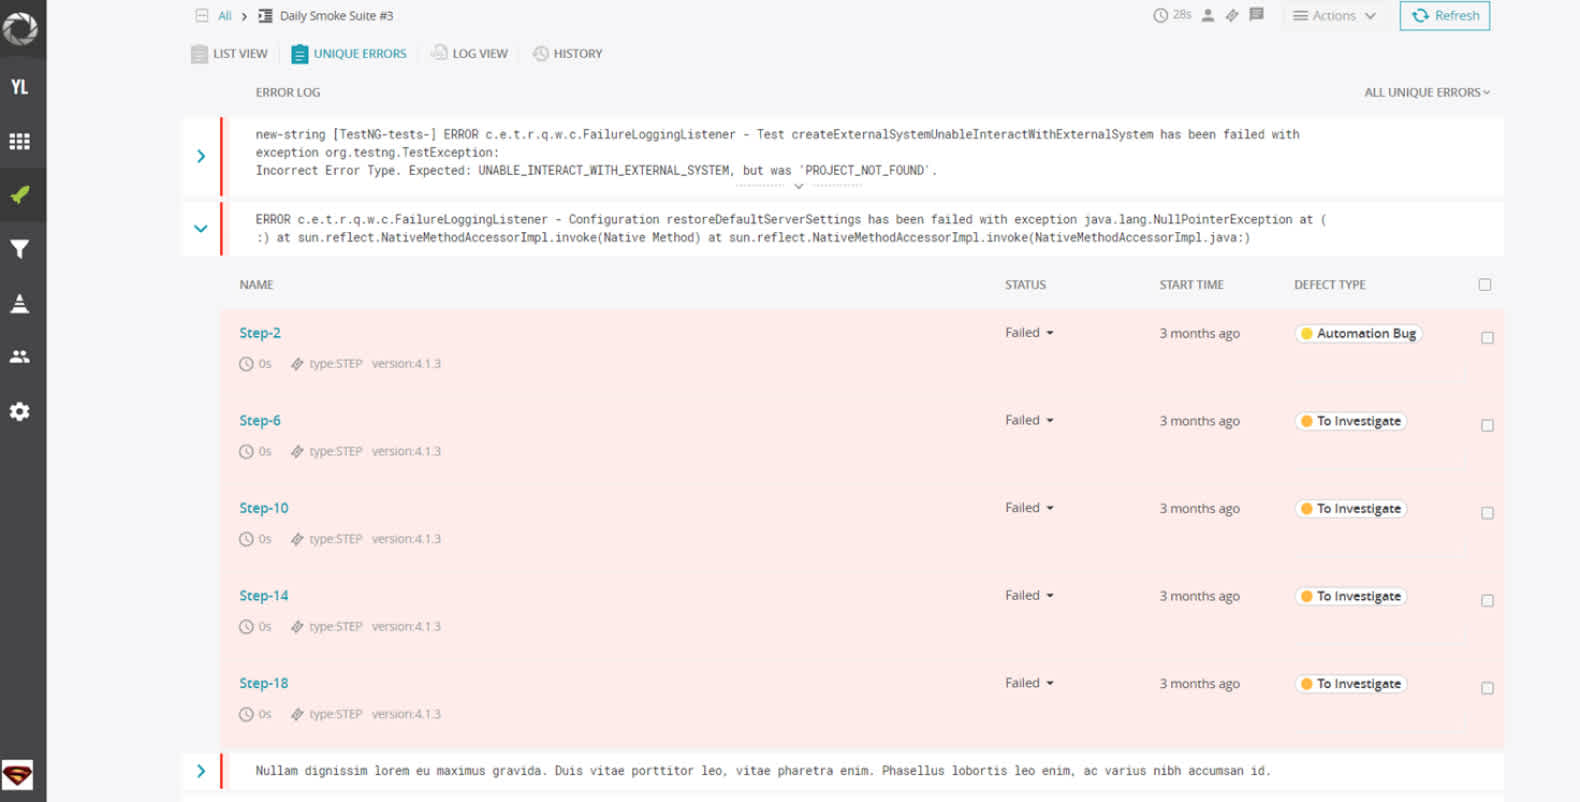
One more feature to facilitate tests results analysis is "Unique Errors".
Let’s imagine, you have 20 failures. Click on the Launch name and open the "Unique Errors" tab. Here you will find common errors for several failures. So, you can see 8 errors instead of 20, for example. Expand an error to check what tests belong to the same one. Then you can select some items and apply defect type/link issue/post issue for them via bulk update.
9. Integrate ReportPortal with BTS
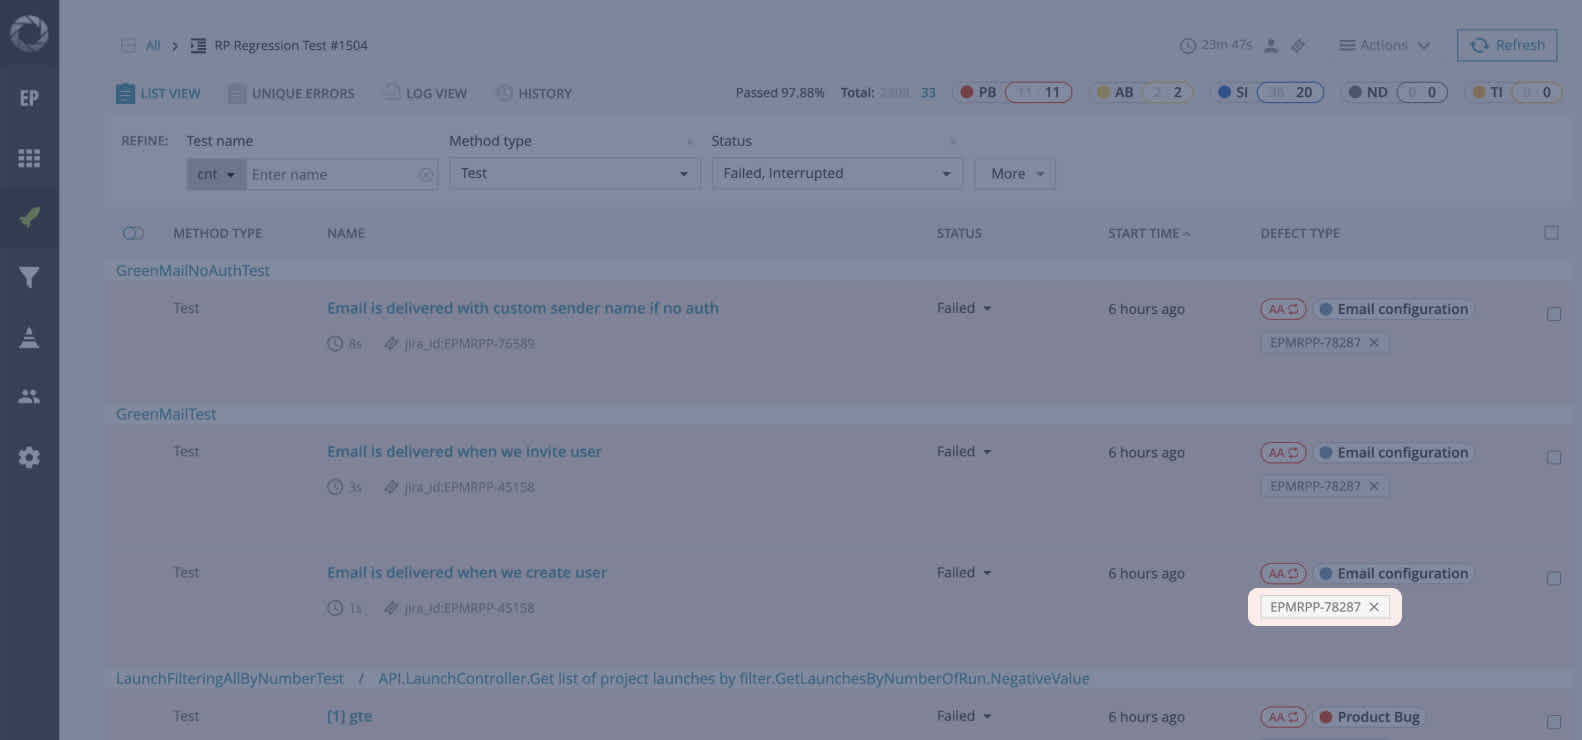
Thanks to the integration with Bug Tracking Systems (Jira Server, Jira Cloud, Azure DevOps BTS, Rally) you will spend time once – when creating an issue.
Thanks to the integration with Bug Tracking Systems (Jira Server, Jira Cloud, Azure DevOps BTS, Rally) you will spend time once – when creating an issue.
10. Use custom defect types
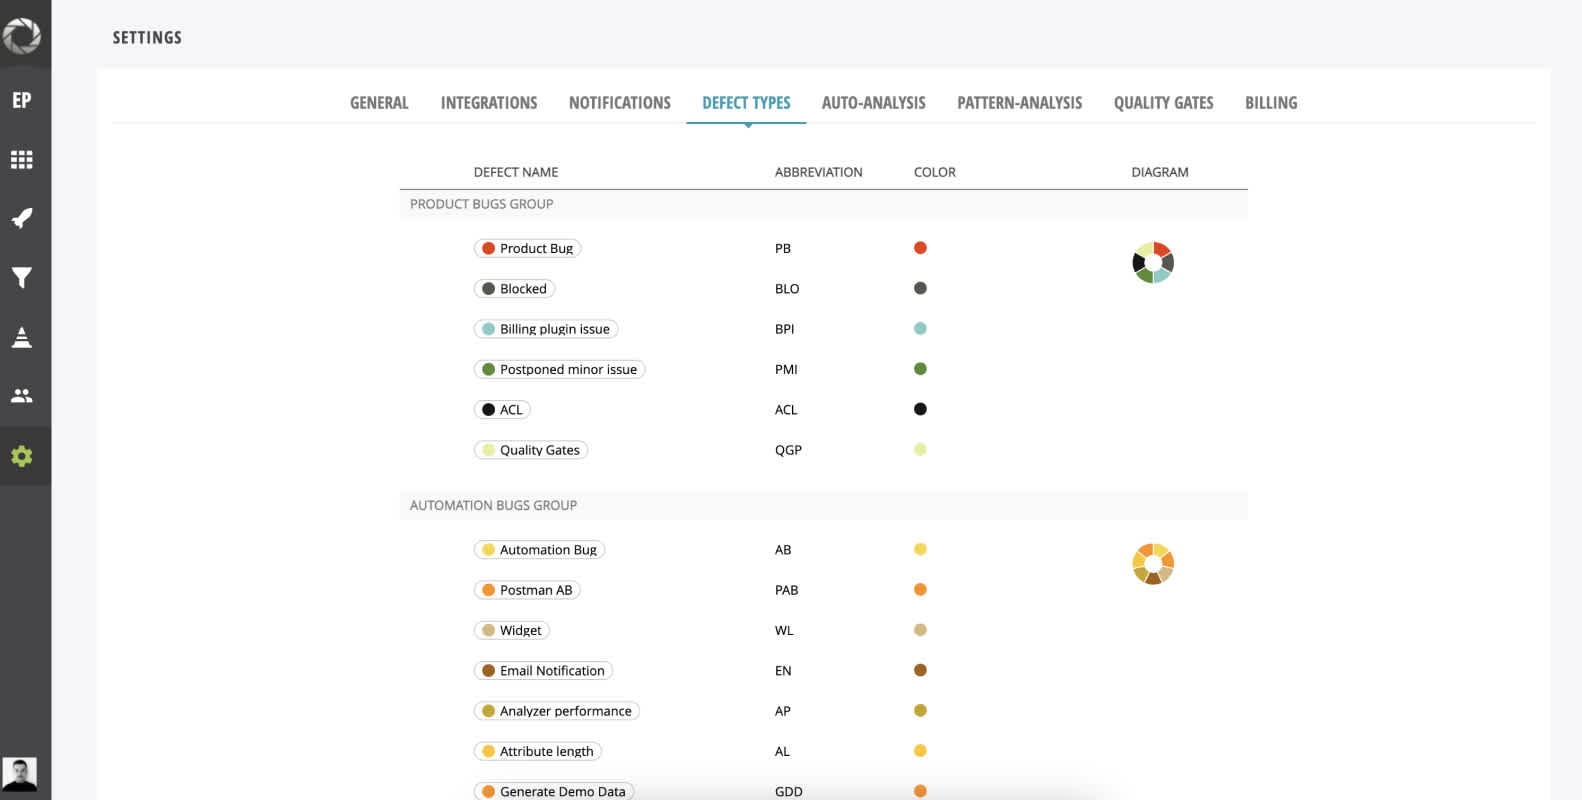
There are 4 main defect types in ReportPortal: Product Bug, Automation Bug, System Issue, and there is also "No Defect " group.
Custom defect types help to identify the most problematic area. For example, you have 5 Product Bugs, and you can specify each of them by functionality.
Another case: you can create "Manually Passed" defect type under "No Defect " group if the test is passed manually. It will help not to affect the overall statistic of the run.
Benefits: to simplify the analysis, add the “Under Investigation” custom defect type or create custom defect type with the assignee name (for example, “Issue for Rob”). So other team members won't spend time analyzing such tests. This is about how to work in a big team without spending time on direct tasks assignments. Use comments as well for additional information or clarification on the issue, to better understand its context and potential causes.
11. Send manual tests in ReportPortal
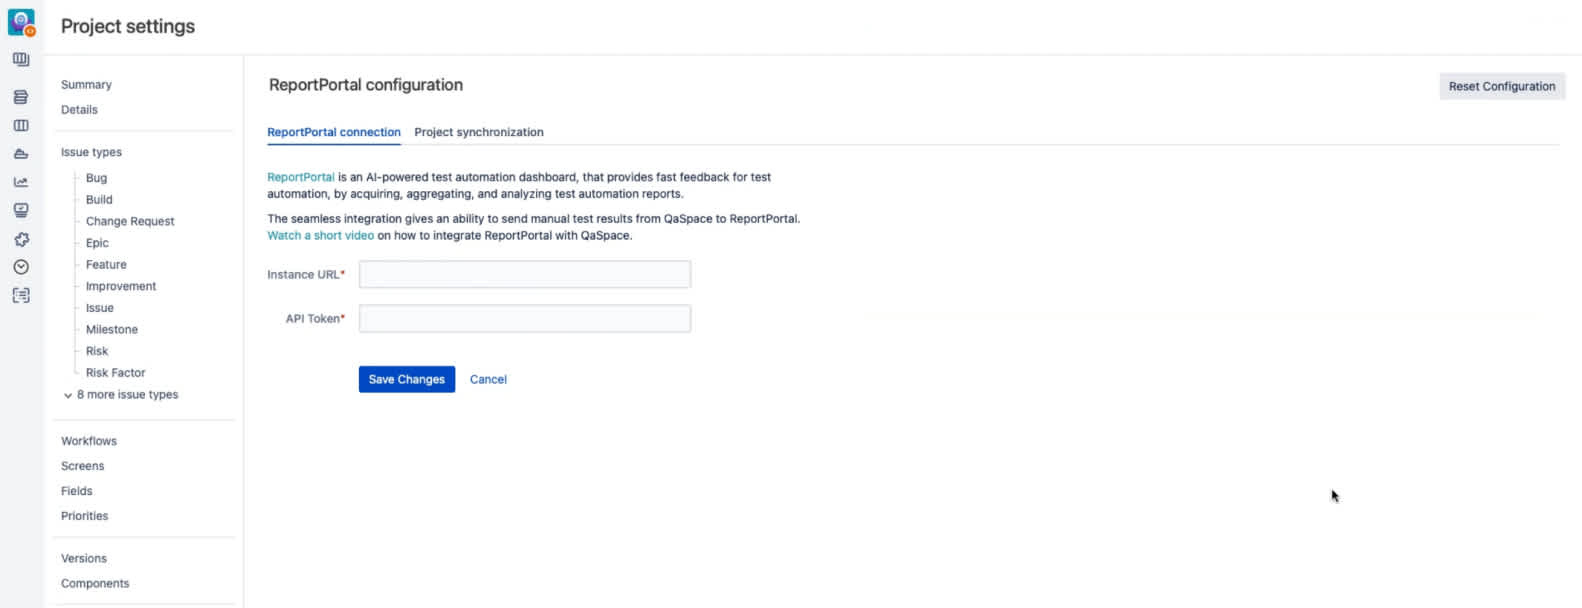
There is a possibility to send tests from QaSpace (Jira plugin) to ReportPortal. It allows to get manual tests results as well and include them in the statistics via widgets.
To configure QaSpace with ReportPortal, copy Access Token from the profile on ReportPortal and use it as API Token for ReportPortal Configuration:
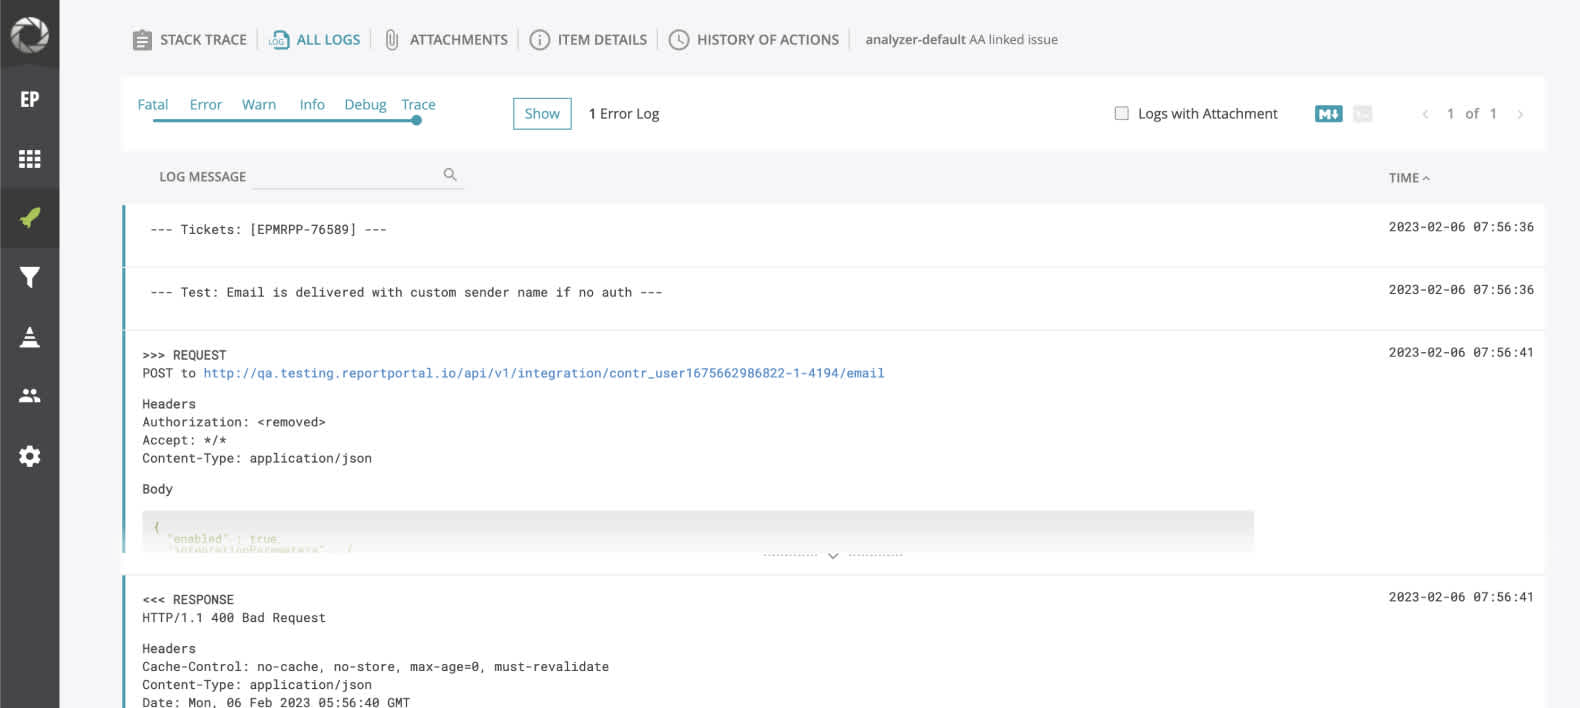
Launches from QaSpace are displayed in ReportPortal like normal launches. The only difference is Test Steps are shown as a Log message.
12. Create widgets
You can create different widgets when all failures are investigated. Widgets show the application quality by area, component, environment on 1 Launch or several Launches.
You can include manual tests from QaSpace in the widgets as well.
Widgets help to see the product's health.
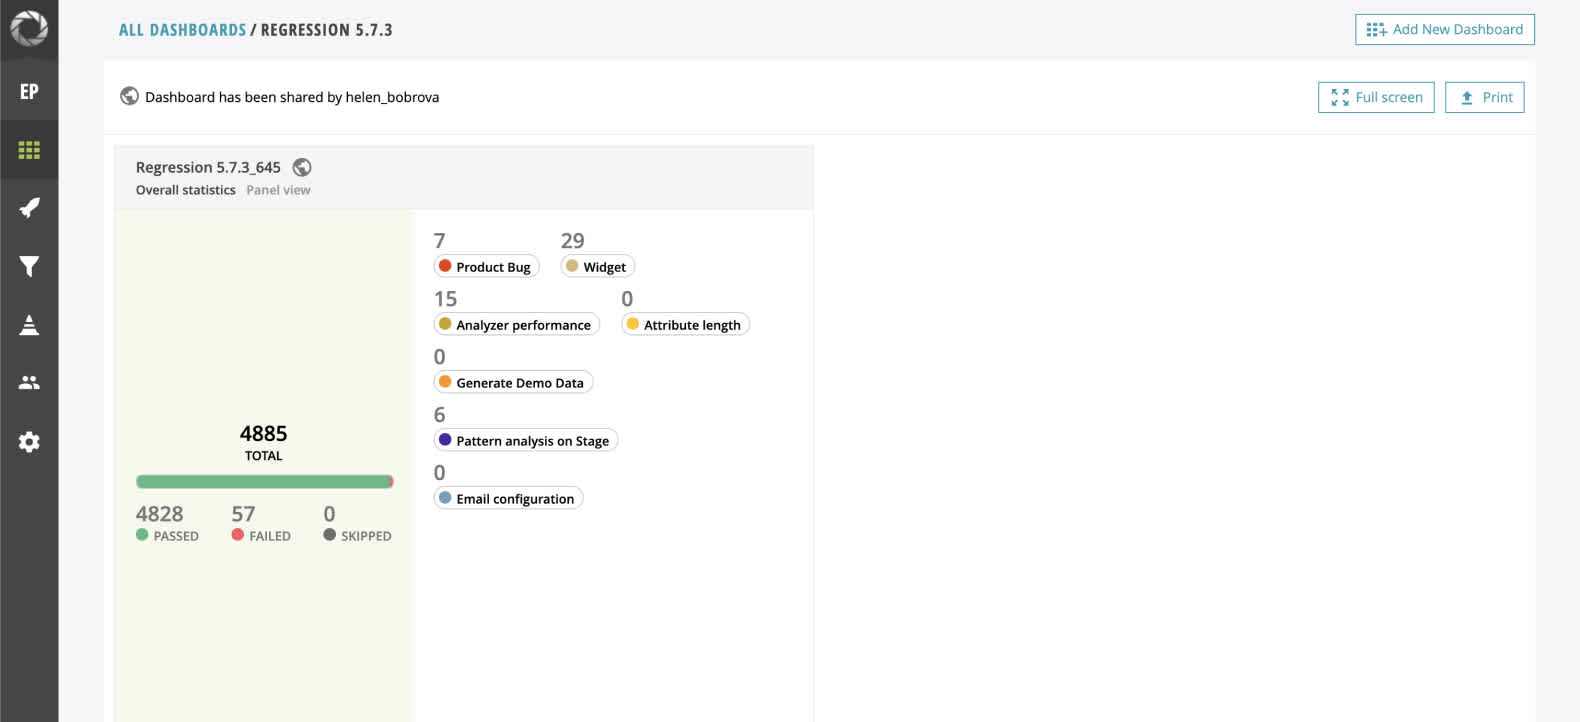
The most popular widget is "Overall Statistics". You can use it (just by doing the screenshot or attaching a link to the dashboard in ReportPortal) in test results reports.
13. Use notifications
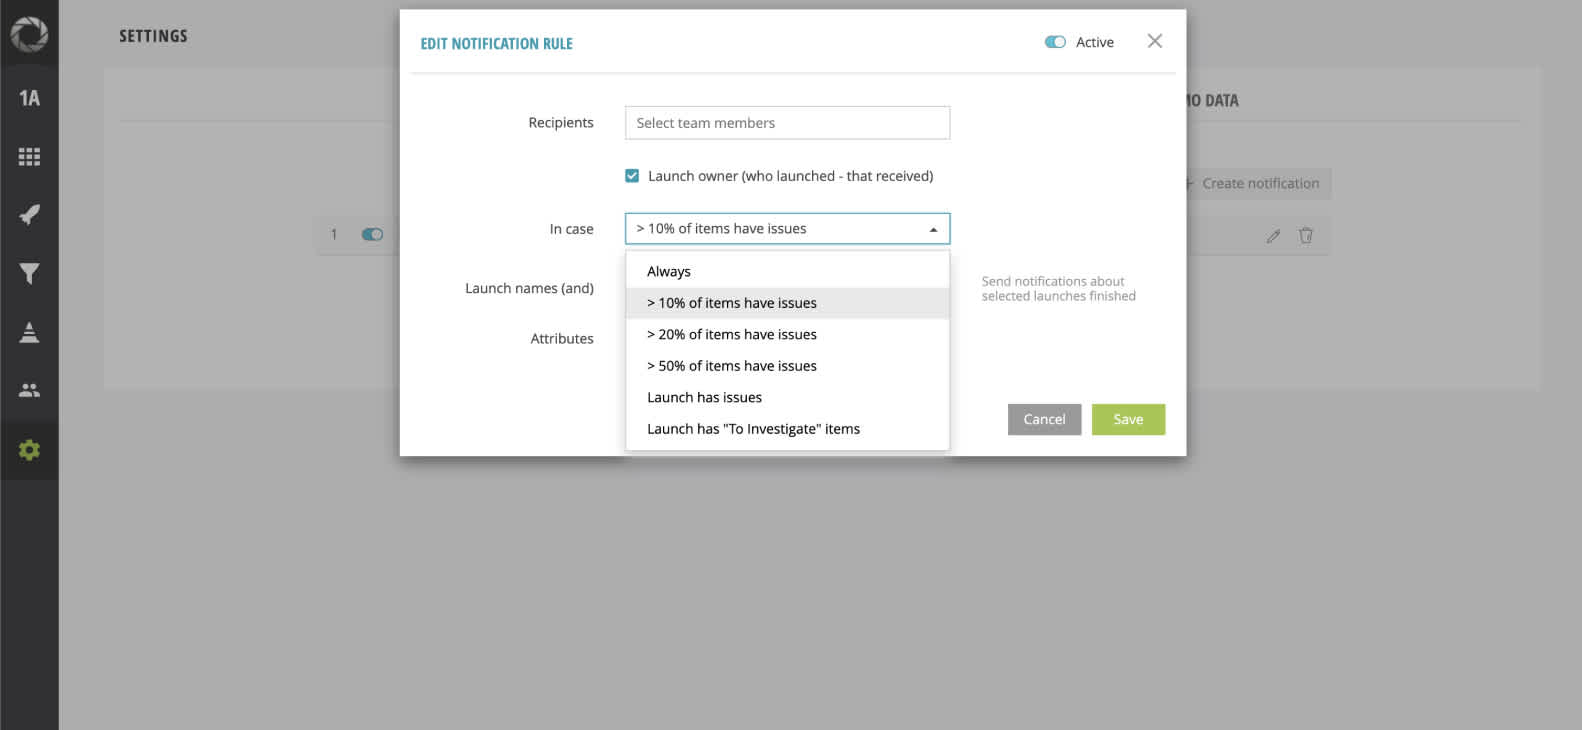
You can apply custom rules with specific conditions to send a notification on percentage of failed items which is very useful and helps to avoid unnecessary pings in case of random failures.
14. Use Quality Gates
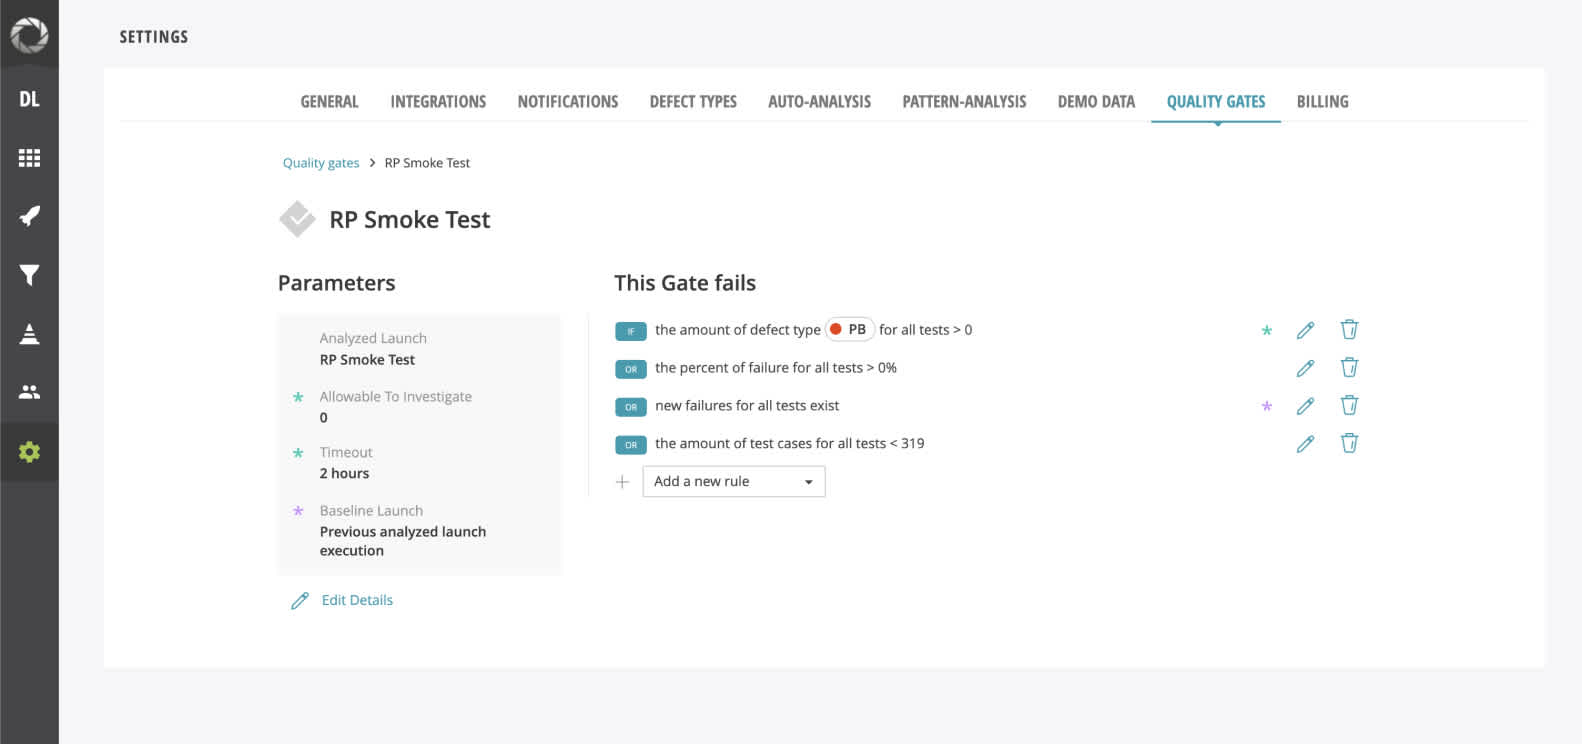
Let’s imagine an ideal test run: no Product Bugs, the percent of failure for all tests is 0 %. Create a Quality Gate with these rules.
While the Quality Gate is running, ReportPortal verifies testing results against the required conditions. It prevents the code from moving forward if it doesn’t meet the criteria.
We hope these tips will help you improve your interaction with ReportPortal and get maximum value for your testing team and the entire project.