The first step in using ReportPortal is reporting your test results. For example, results can be sent to ReportPortal through test frameworks for Java, JavaScript, .NET, Python, PHP, and others. Once your test data is submitted, you can take advantage of ReportPortal’s powerful capabilities for analyzing and visualizing test results.
Why use ReportPortal for test results?
ReportPortal helps teams manage and visualize test results in one place. Its easy-to-use dashboard and real-time analytics make it simple to understand testing progress and make better decisions.
Watch our video on test result visualization!
With AI-powered features, ReportPortal makes analyzing test results faster and smarter by automatically identifying reasons for test failures. The better your test data is structured, the more valuable insights you’ll get from ReportPortal’s visualizations. For this reason, following best practices in reporting is crucial to achieving better visualization.
Use Consistent Launch Names
Leverage Attributes
Reporting best practices for greater visualization
Using consistent Launch names
Imagine a team running end-to-end (E2E) tests. Each test execution creates a new launch in ReportPortal. To ensure the "Latest launches" feature works effectively, the launch names should remain consistent across runs. Avoid dynamic values like timestamps or build numbers in launch names – instead, use attributes for these details. Why does this matter? Maintaining consistent launch names is crucial for effectively utilizing the "Latest launches" feature, which displays only the most recent launches based on their names. It also facilitates tracking the history of a test case through the same launch, in addition to viewing it across all launches.
ReportPortal's demo instance demonstrates these capabilities. By signing up through GitHub, users can explore how features like "Latest launches" streamline test tracking. For instance, four launches – two for E2E tests and two for Unit tests – can be reported.
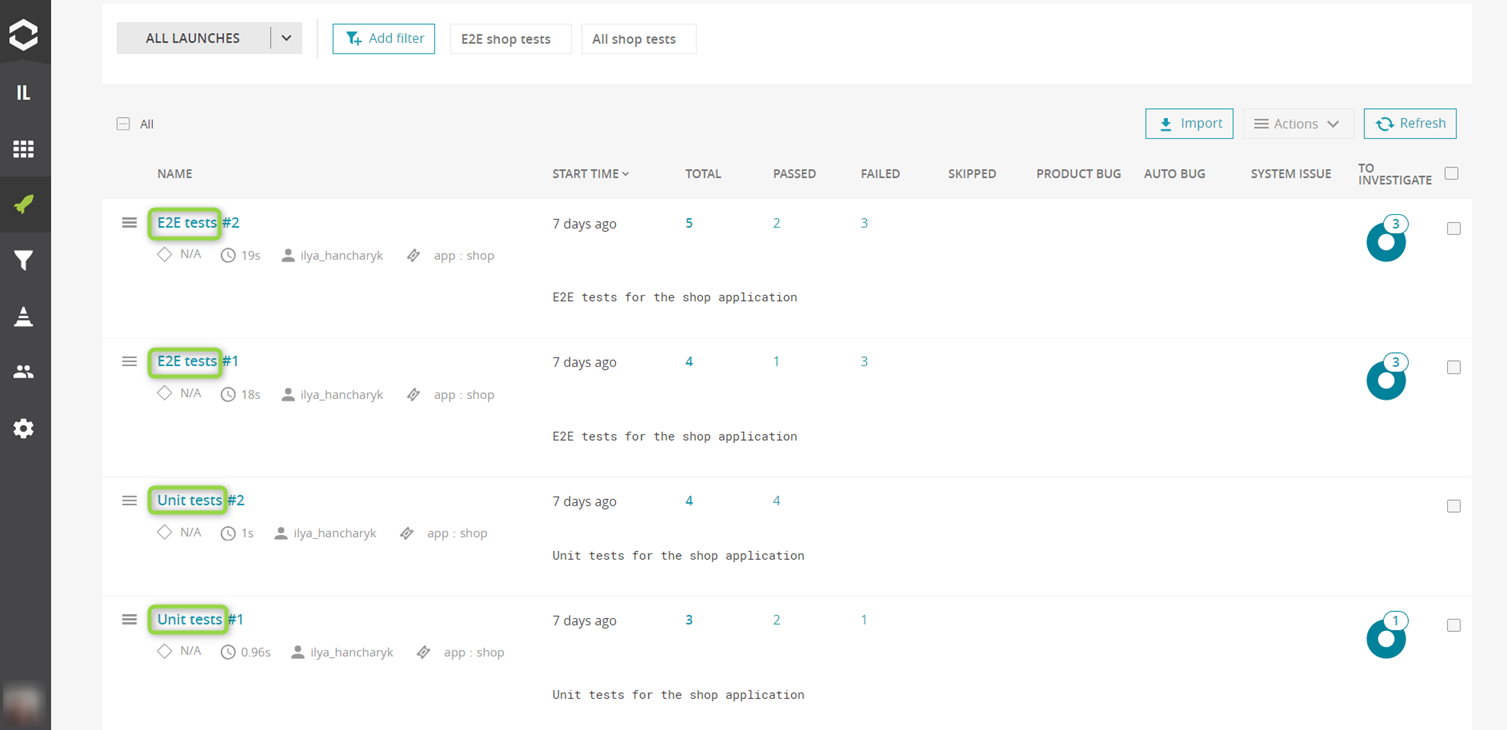
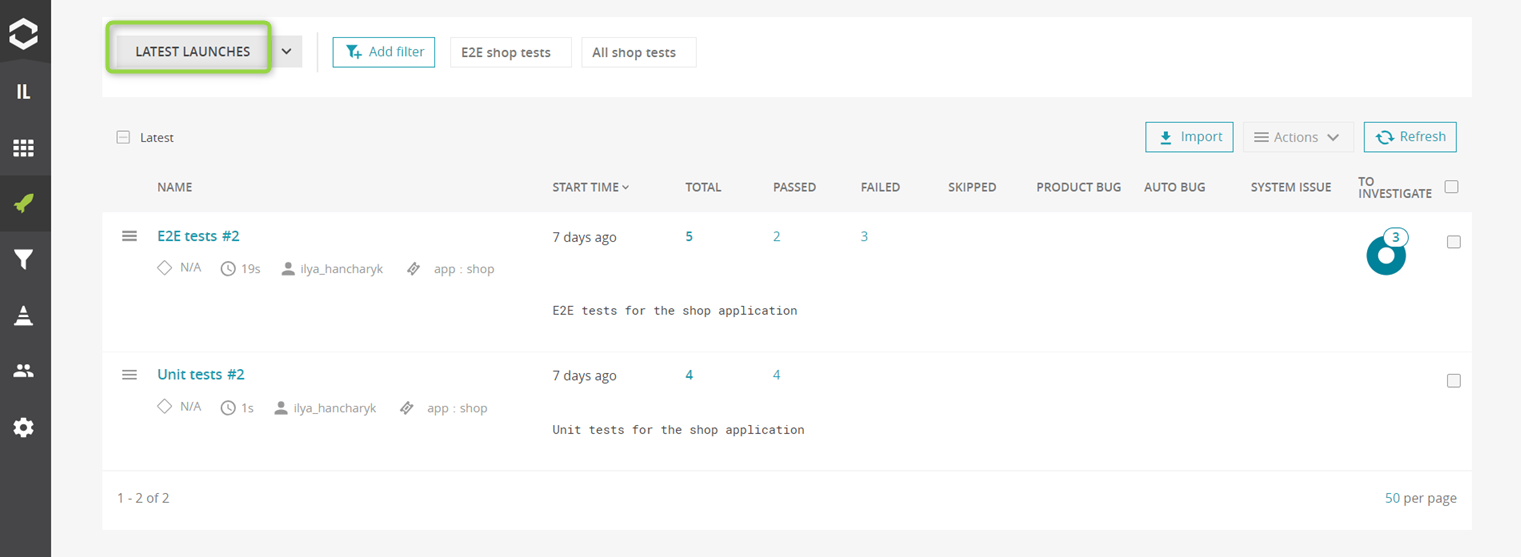
Using the "Latest launches" control, users can focus only on the most recent executions for each launch name. This feature simplifies tracking when numerous launches are reported, and it can also be used to configure widgets.
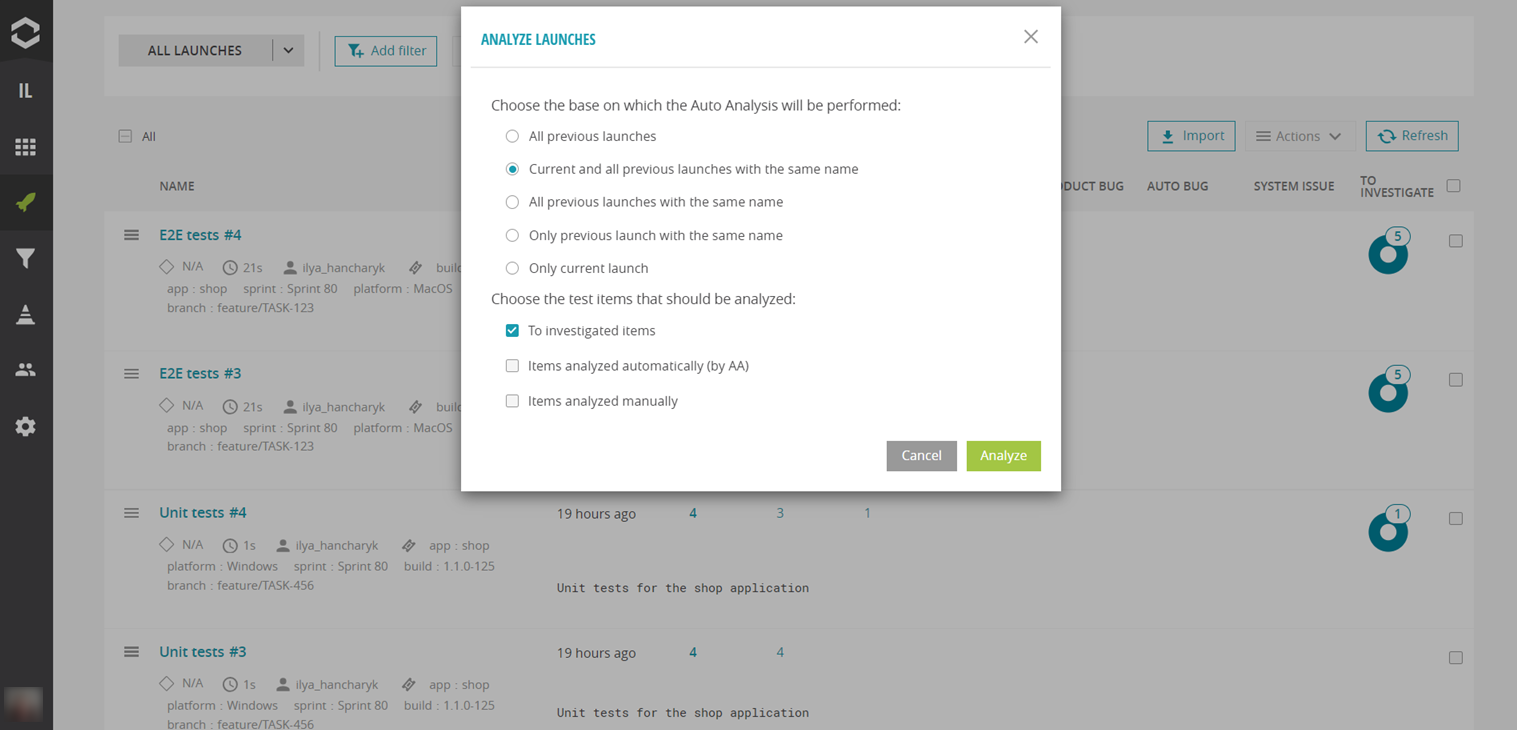
ReportPortal's Analyzer can also be configured to work with launches that share consistent names, enabling more targeted decision-making. Additionally, Notification and Quality Gate rules should be set up for launches with specific names.
Leveraging attributes
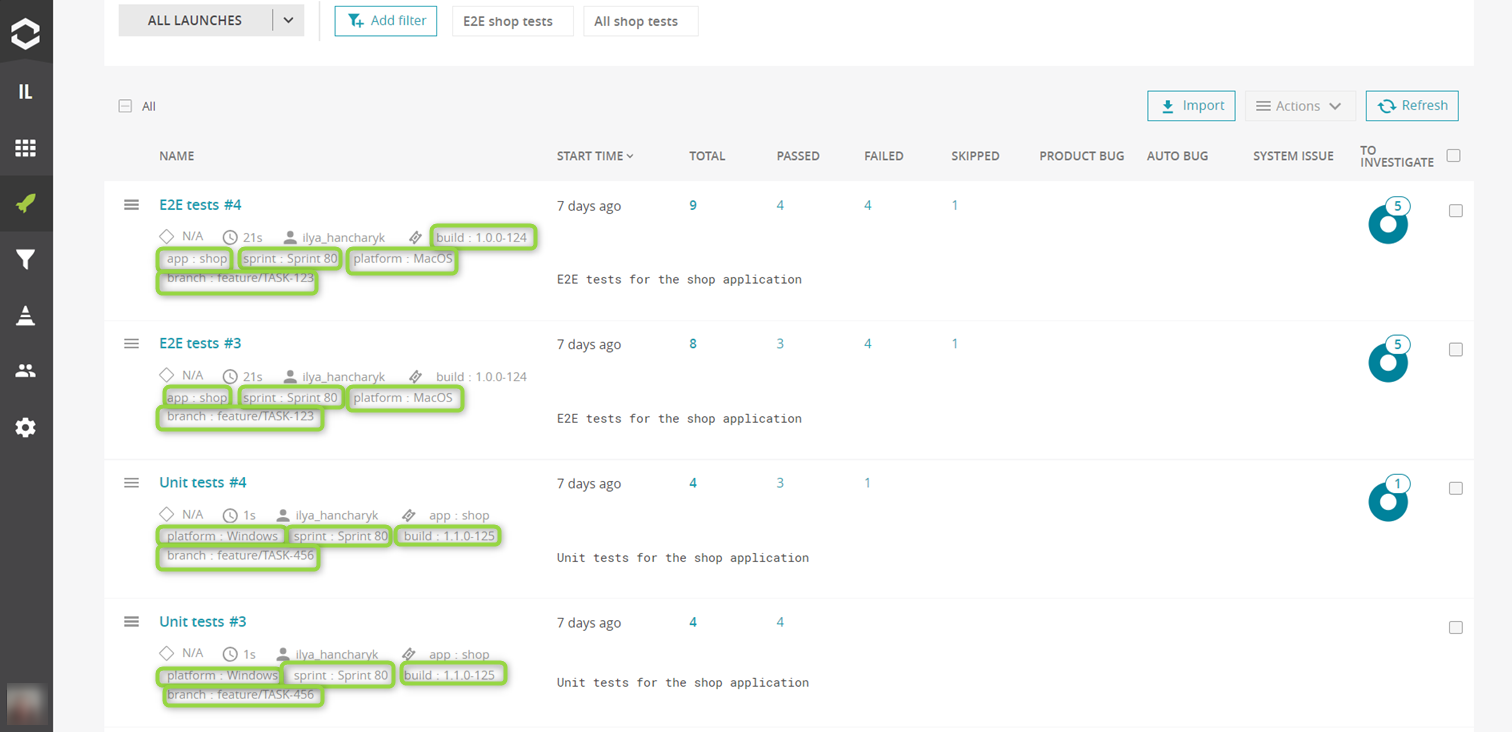
ReportPortal attributes is a powerful feature that allows users to add metadata to their test results in a structured way. Like tags in automation frameworks, attributes in ReportPortal are used to categorize and filter test data, but they offer a bit more flexibility and detail. Attributes in ReportPortal are defined in a key:value format, which allows for more precise classification and retrieval of test information. A small project with E2E and Unit tests written using Playwright and Node.js can serve as an example for updating the ReportPortal configuration with meaningful attributes. The product type, such as app: shop, can be predefined, with additional dynamic values – like build number, platform, branch, sprint – being derived from environment variables.

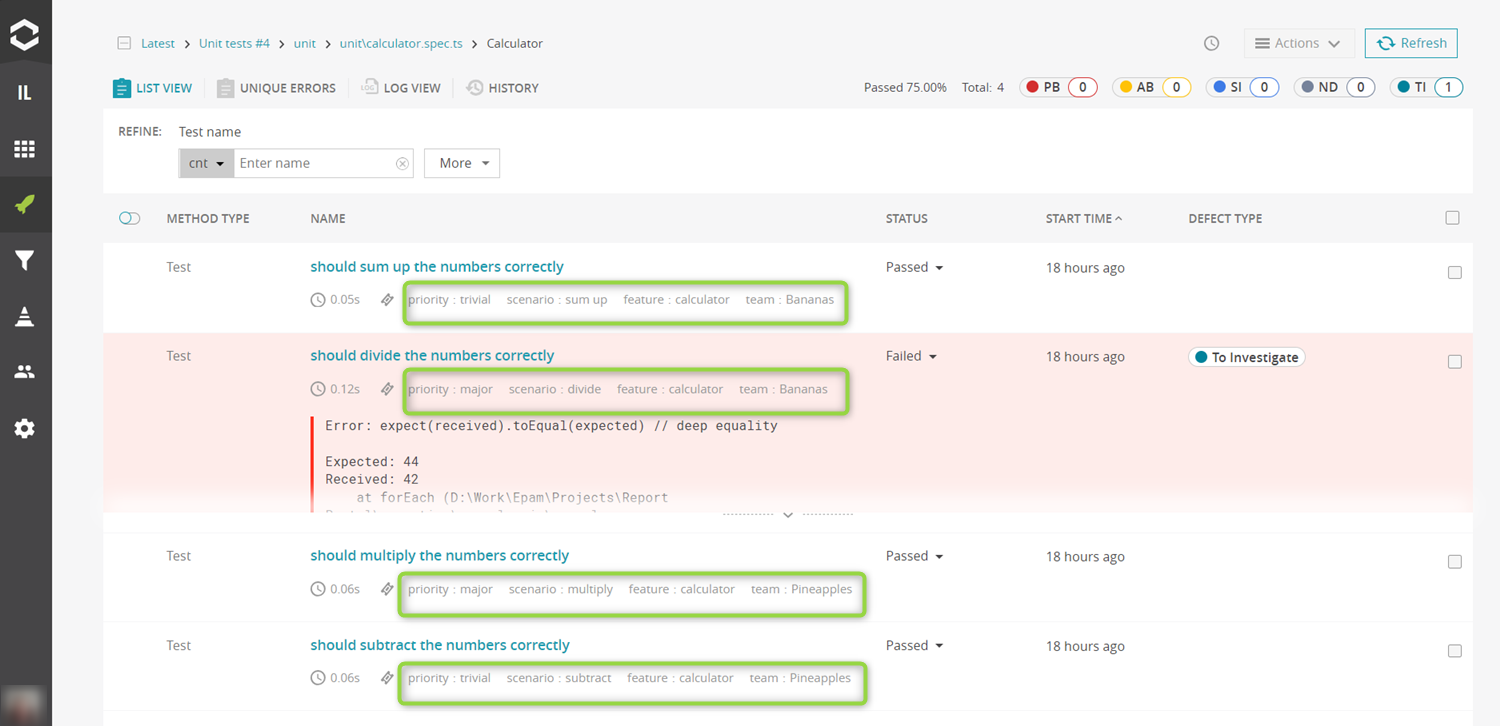
Consider a scenario where different teams contribute their tests to a single repository, and these tests are executed in a collective suite and reported as a single launch in ReportPortal. In this case it would be helpful to attach attributes at the test level to later distinguish which team the tests belong to. Add team, feature, priority, scenario attributes.

For users working with Playwright or Cypress, there are separate videos demonstrating how to include attributes and additional data in test results: one for Playwright and another for Cypress. Additionally, there is separate documentation for Playwright and Cypress, as well as for other test frameworks. After adding attributes and running tests, the ReportPortal UI displays these attributes. To check the test attributes, we need to drill down to the launch. They are presented under the test name and can also be used for filtering the list.
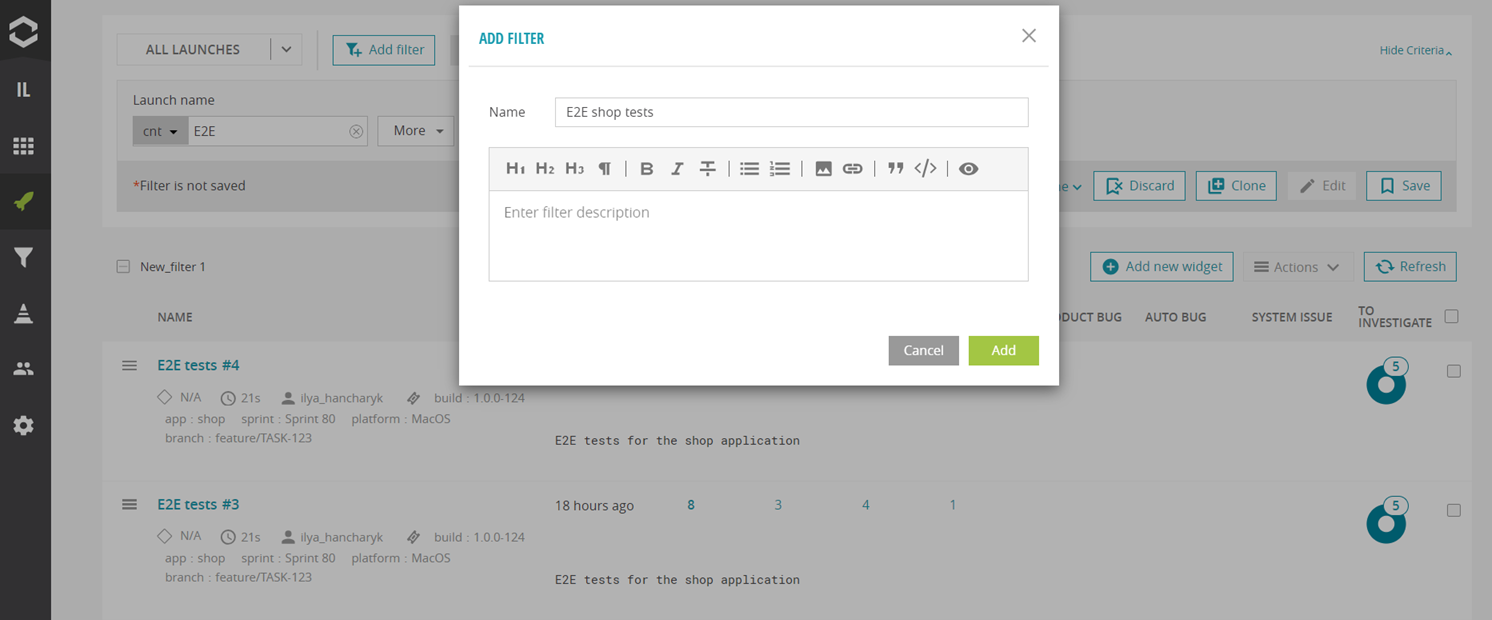
At the launch level, attributes can be used to filter the launch list directly. To use these attributes effectively, saved searches for launches, called "Filters", can be created in ReportPortal. For instance, if you want information specifically about the E2E tests, create a filter for E2E shop tests.
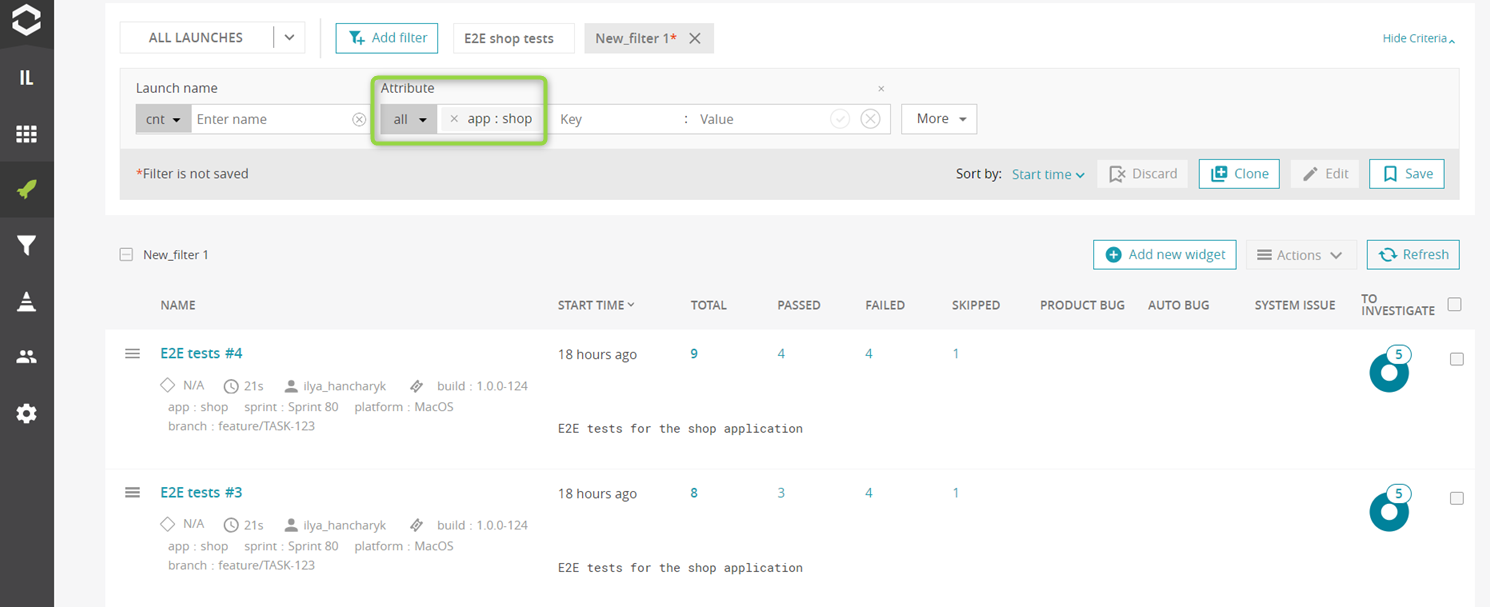
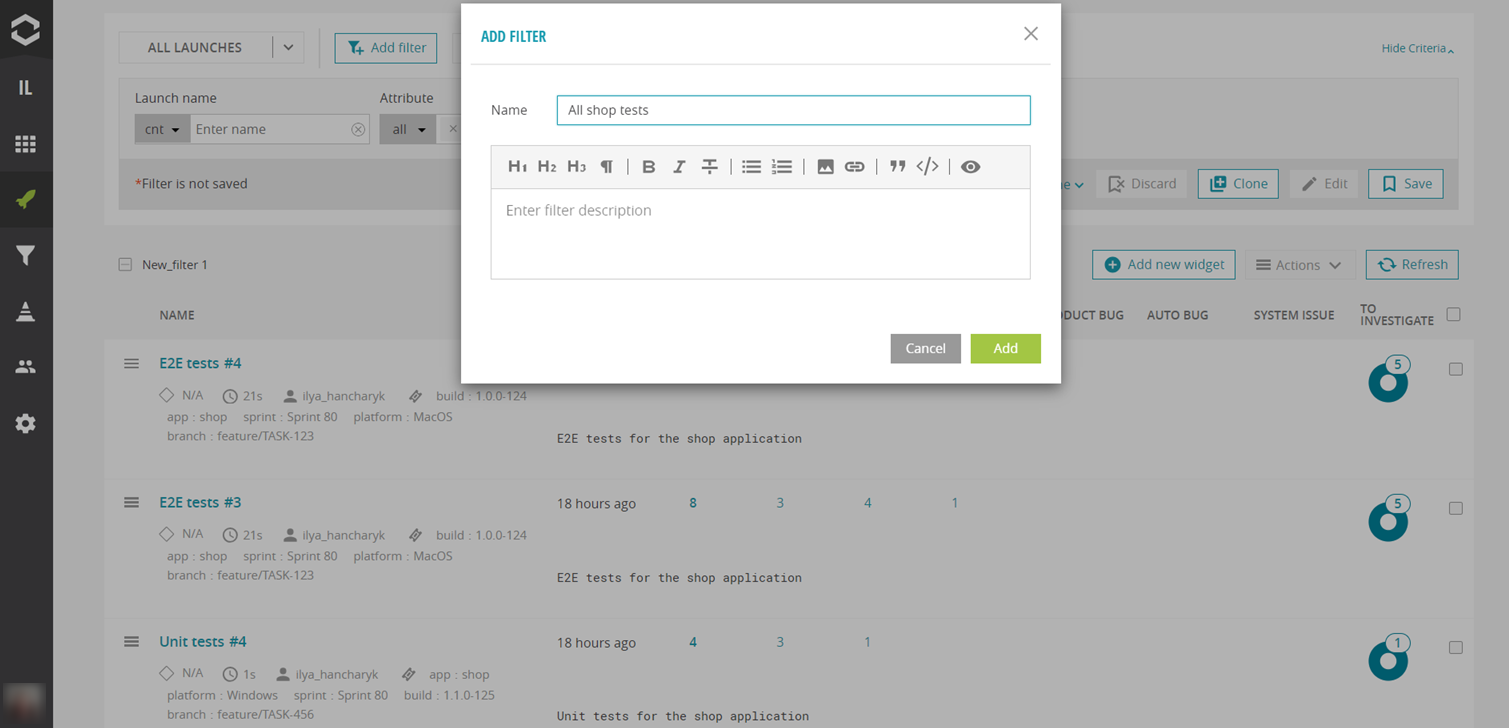
To gather a broader overview, create another filter that displays all the launches for our application, simply by using our common attribute app: shop and name it as All shop tests.
How to visualize test results with attributes
After these preparations, widgets can be created to visualize the data.
Component Health Check widget
For example, Component Health Check and his big brother – Component Health Check (table view). Component health check widget shows the passing rate of the application components, indicated by the attributes specified for test cases. Any attributes can be used to build the structure that addresses your needs. You can create a widget for each existing filter right on the Launches page.
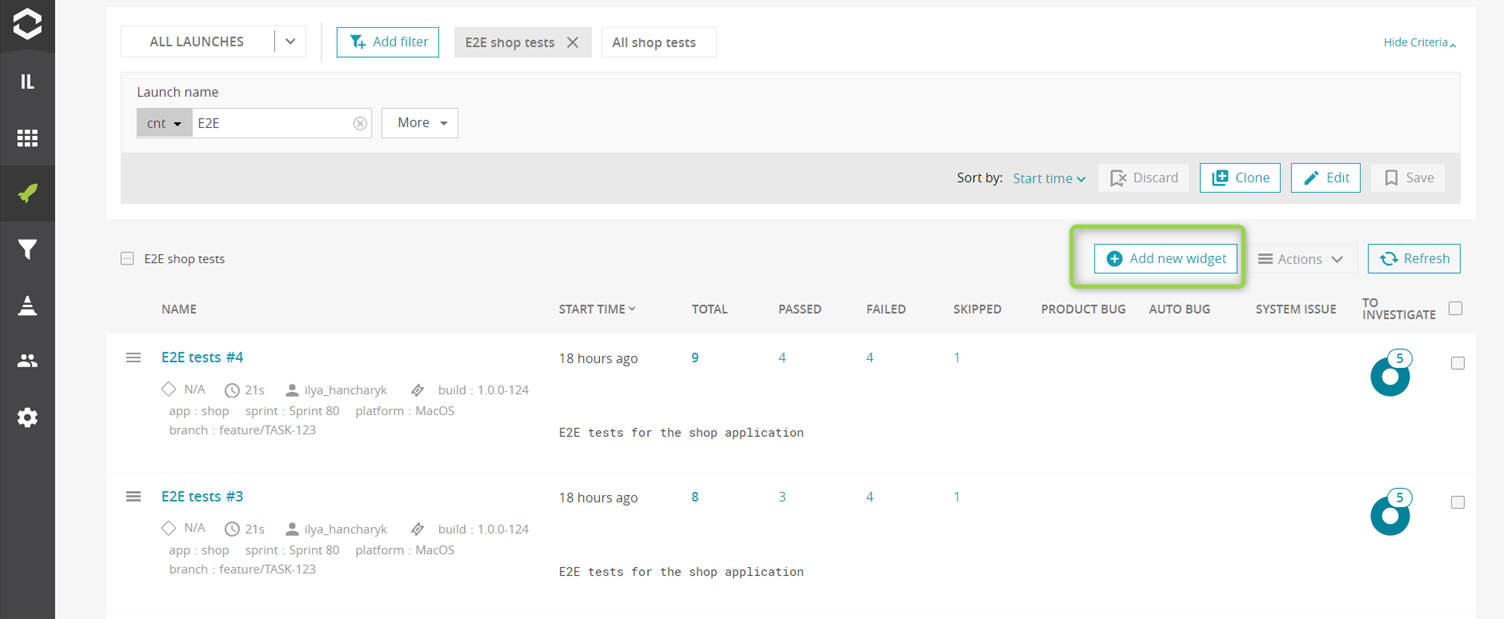
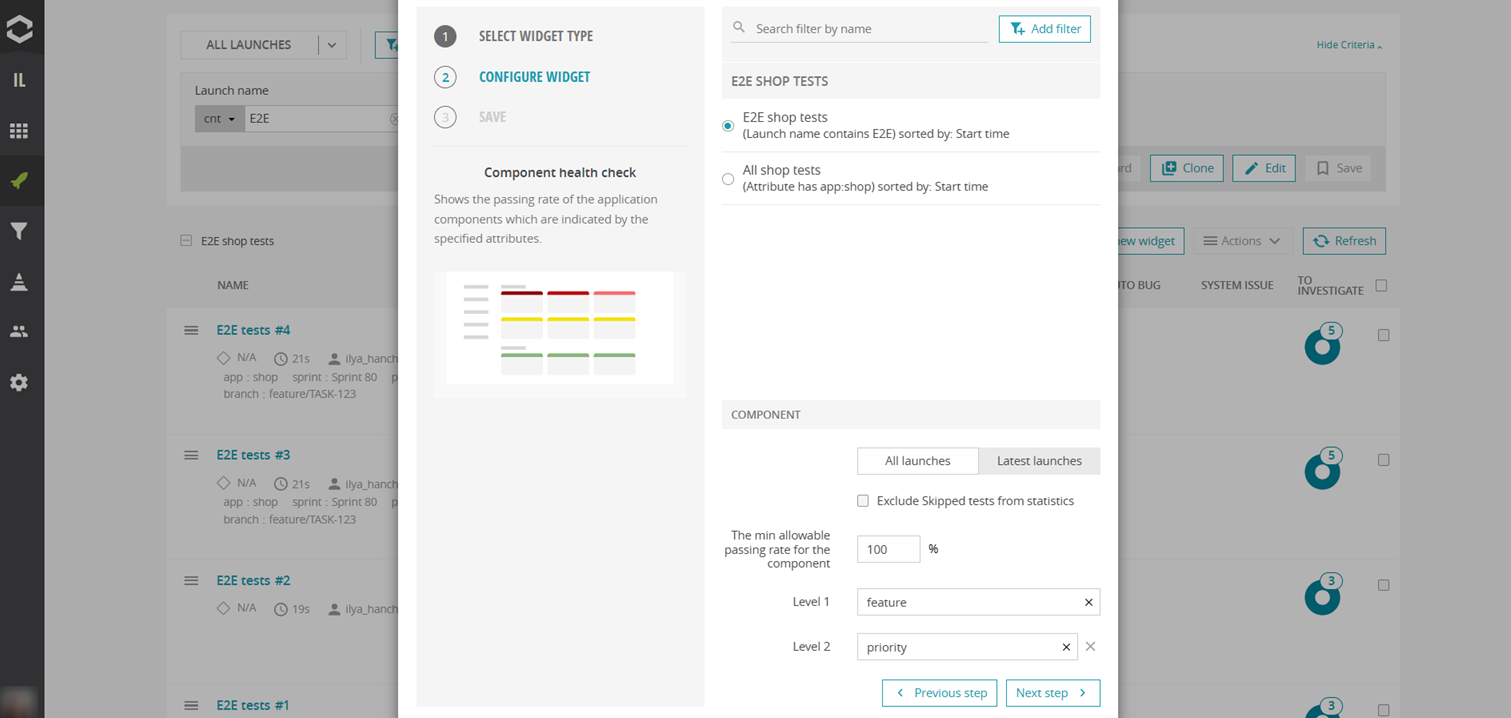
As one example, the E2E filter can be selected to create the Component Health Check widget based on it. Filter conditions can be edited directly if changes are needed in the selection of launches. The option "Latest launches" can be applied to focus the widget on the most recent results. Additional levels, such as feature, priority, platform, team, and scenario, can be added. If no dashboard exists for selection, a new one will be created. The widget can then be named E2E tests by feature.
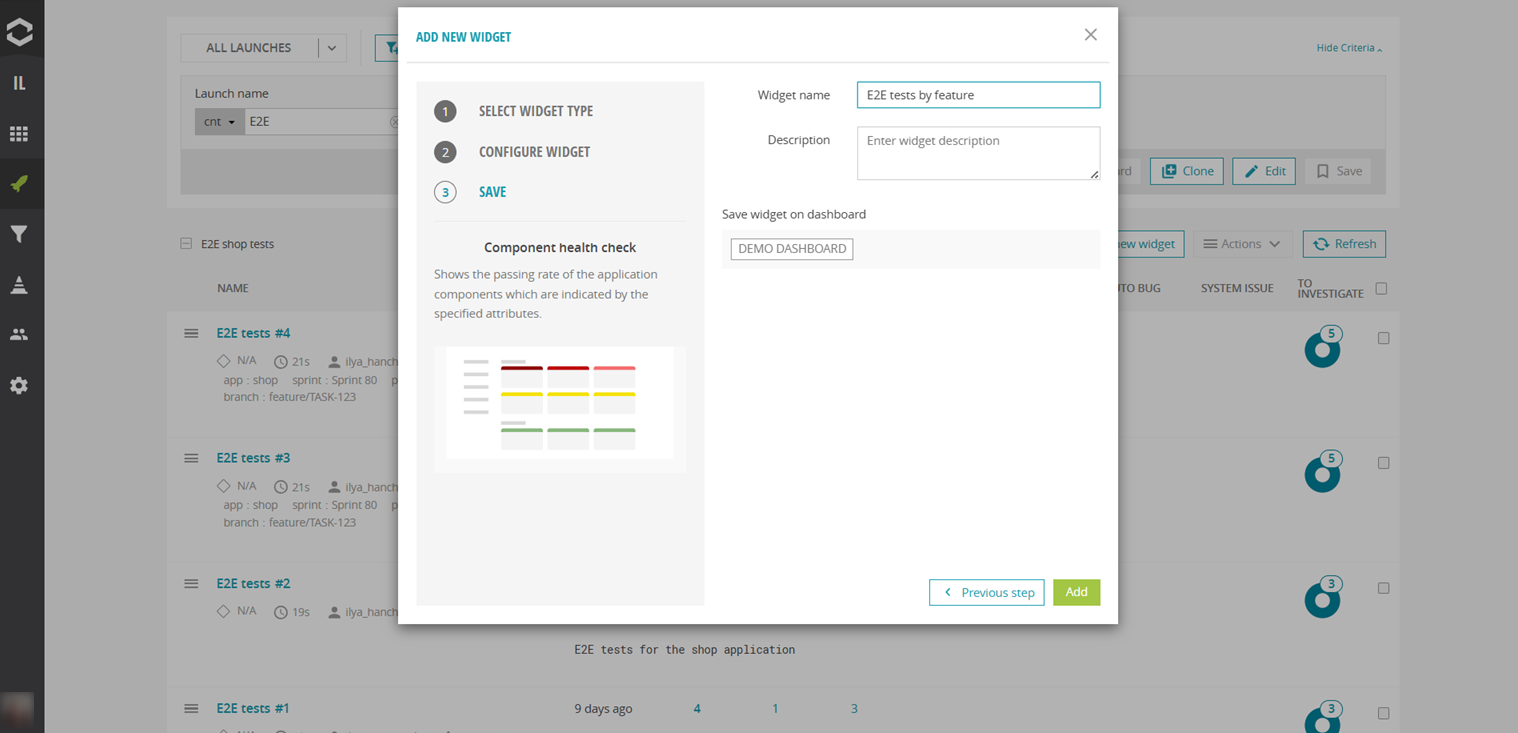
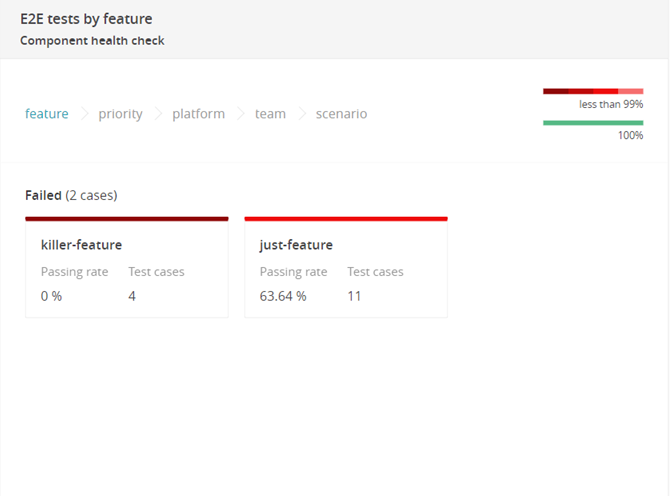
The newly created dashboard contains aggregated test cases from all launches in the E2E filter, grouped by attribute values. All features are displayed, and selecting one allows viewing the tests' passing rates for different priorities.
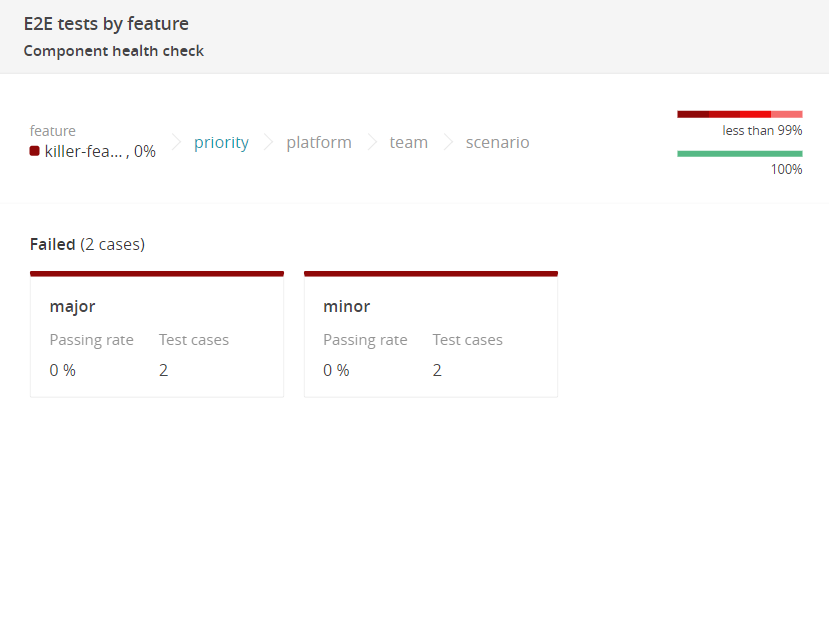
Further exploration reveals execution results for each platform.
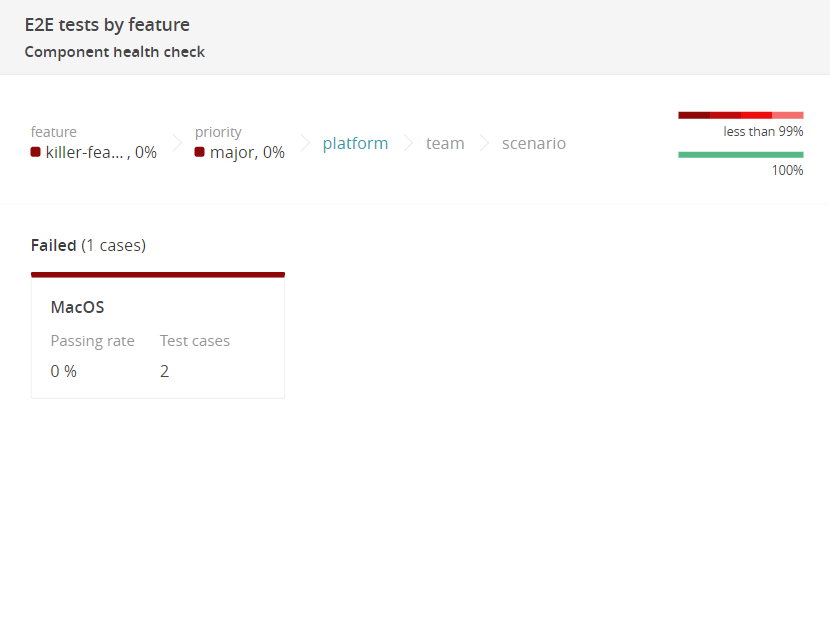
If identifying the responsible team is necessary, deeper levels can be accessed.
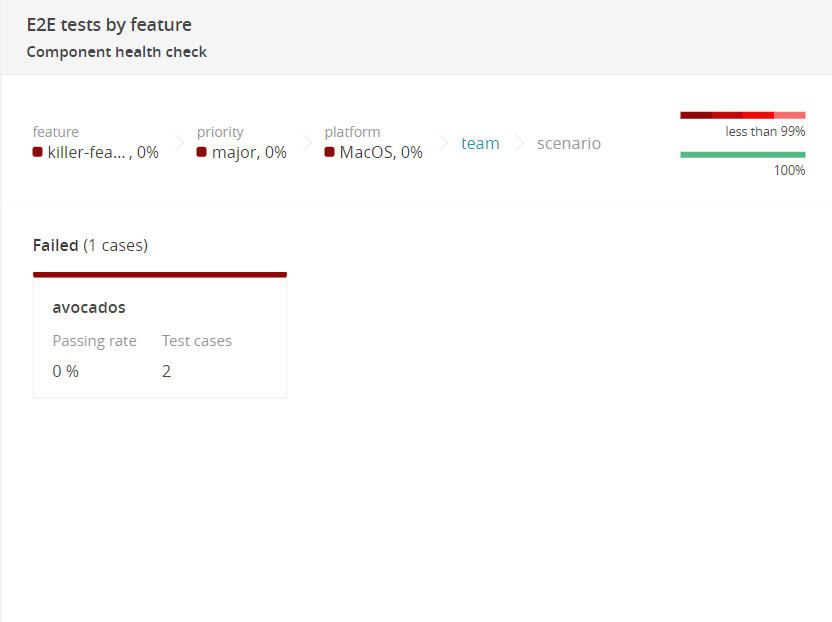
Once the target group is located, the test results list can be accessed for further investigation by clicking the "Open list button". This option is available from any level.
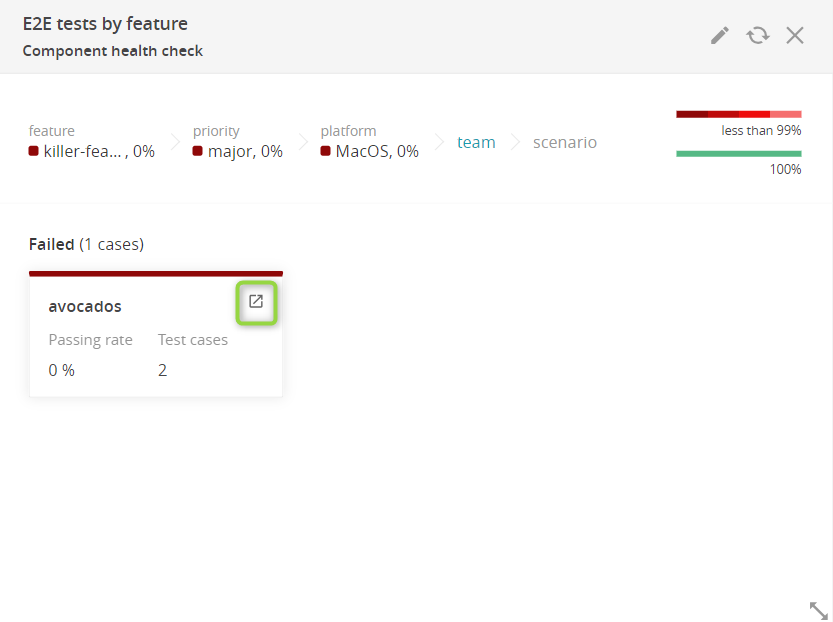
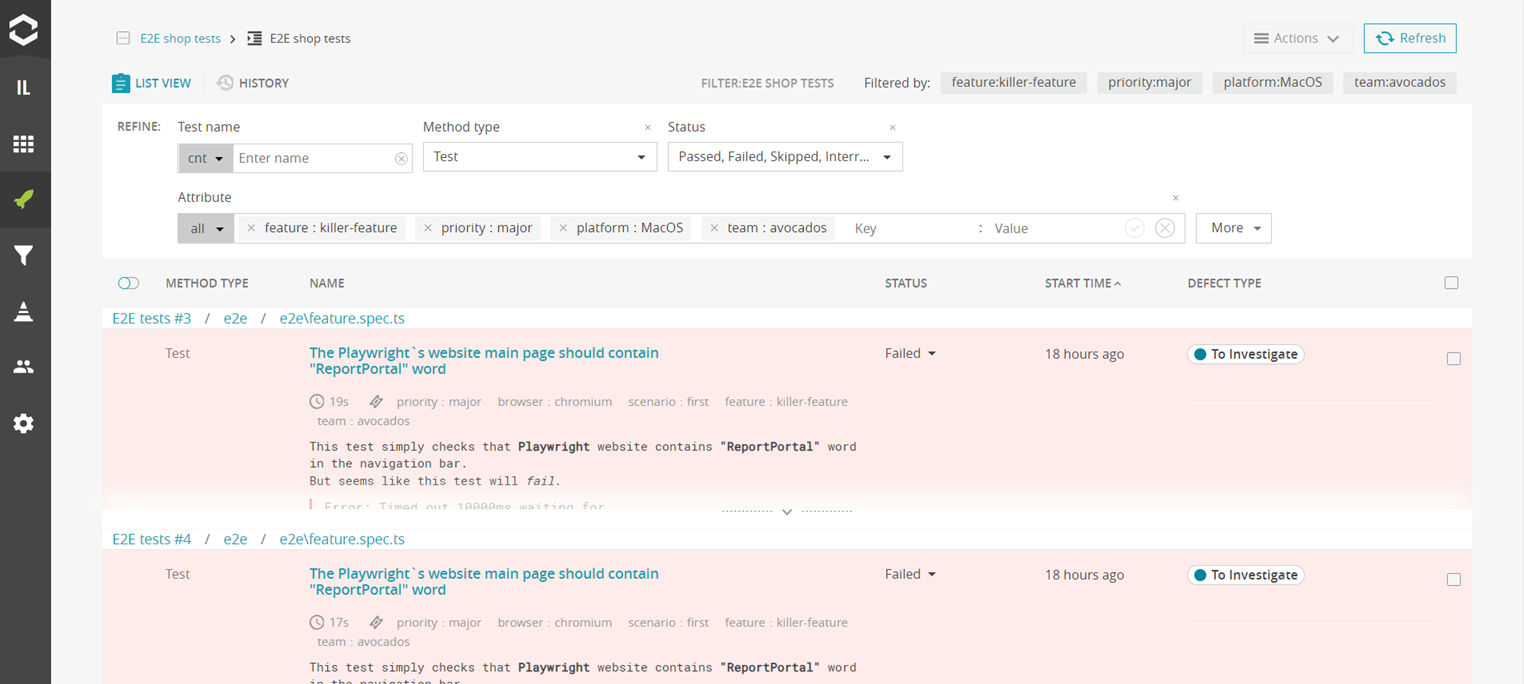
This process demonstrates how any structure can be built with the Component Health Check widget by using correctly specified attributes.
Component Health Check table view widget
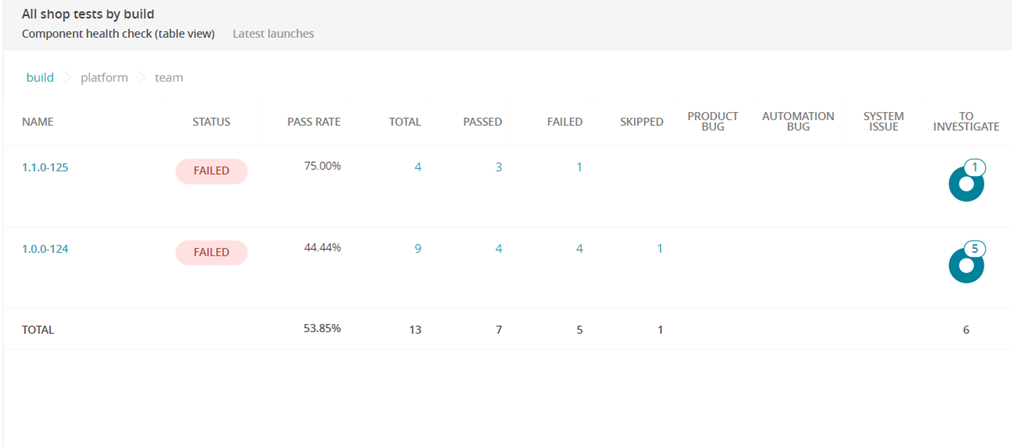
Next, let’s build Component Health Check table view widget. It presents detailed statistics of the application components which are indicated by the specified attributes. Although it is like the previous widget, this one shows more data, including issue statistics. For this widget, the All shop tests filter is used. The Latest launches option is selected, along with the following levels: build, platform, team. It is possible to mix attributes from both the launch and test levels, as launch-level attributes are automatically propagated by ReportPortal to all its children.
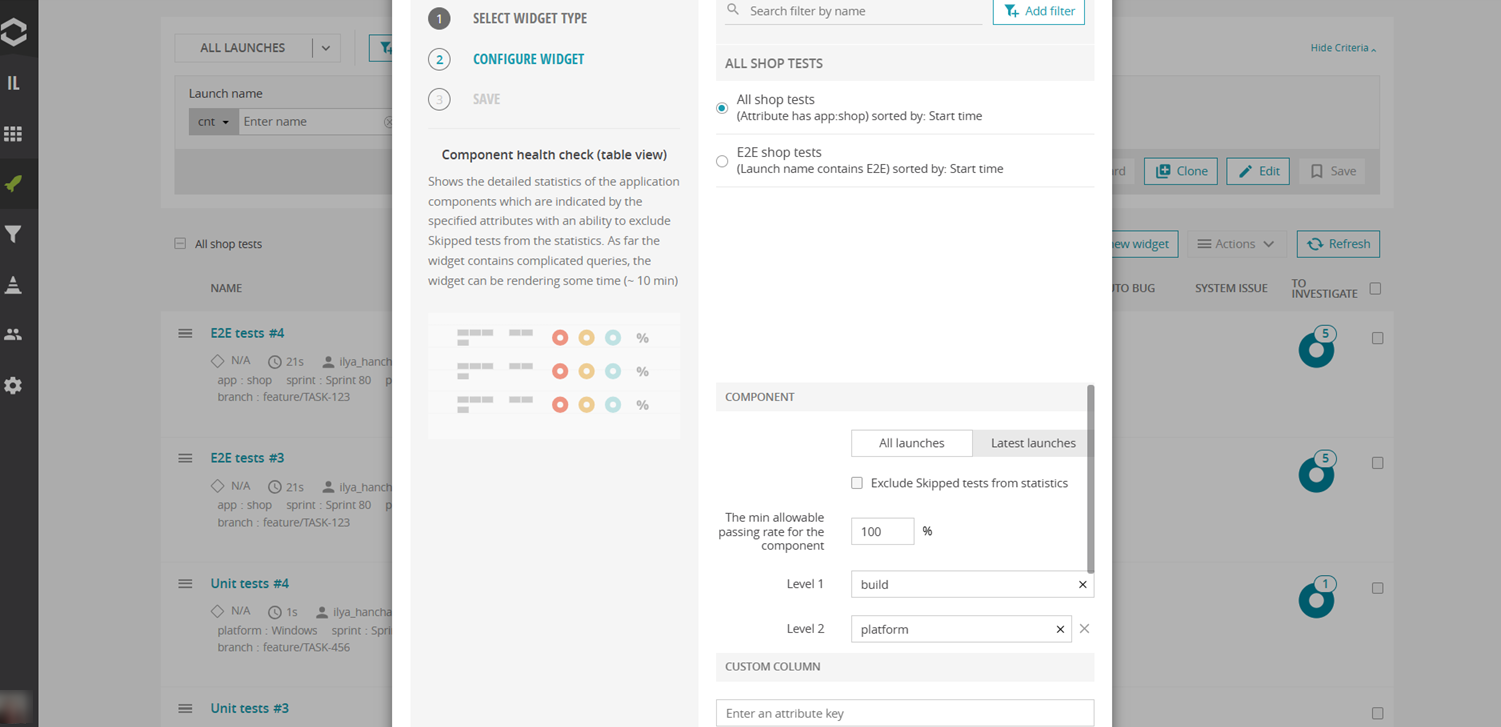
Once the widget is created, additional time may be required to process a large amount of data. Afterward, it becomes possible to drill down to the next levels, revealing grouped test results and additional information about statistics and defects.
Both Component Health checks are extremely powerful and can cover many of your needs, but let's look at the other useful widgets that ReportPortal offers.
Widgets by purpose
Analytics for a single test run
Gain actionable insights into individual test runs with these three essential widgets, designed to highlight key metrics such as pass rates, flaky tests, and time-consuming cases. Passing rate per launch While this widget is simple, it clearly provides main information about the results of the last run.
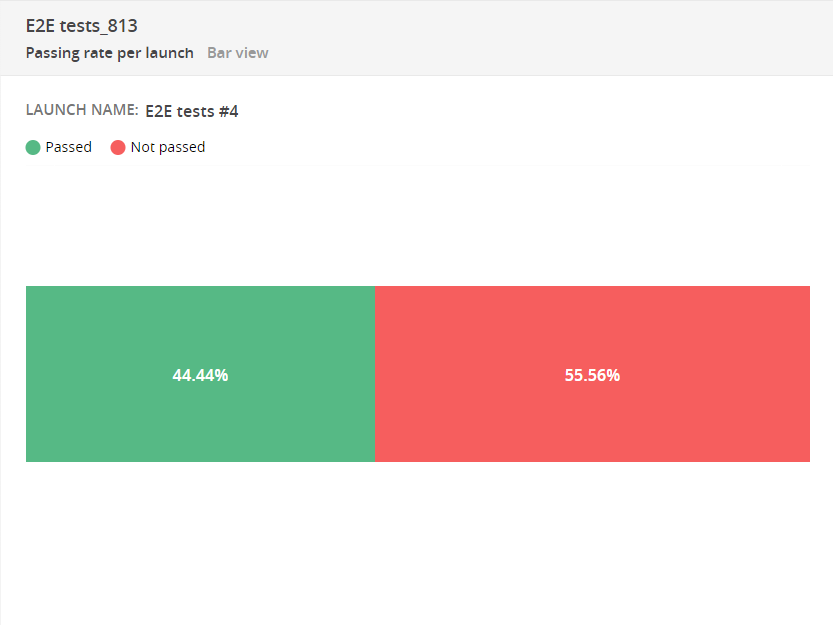
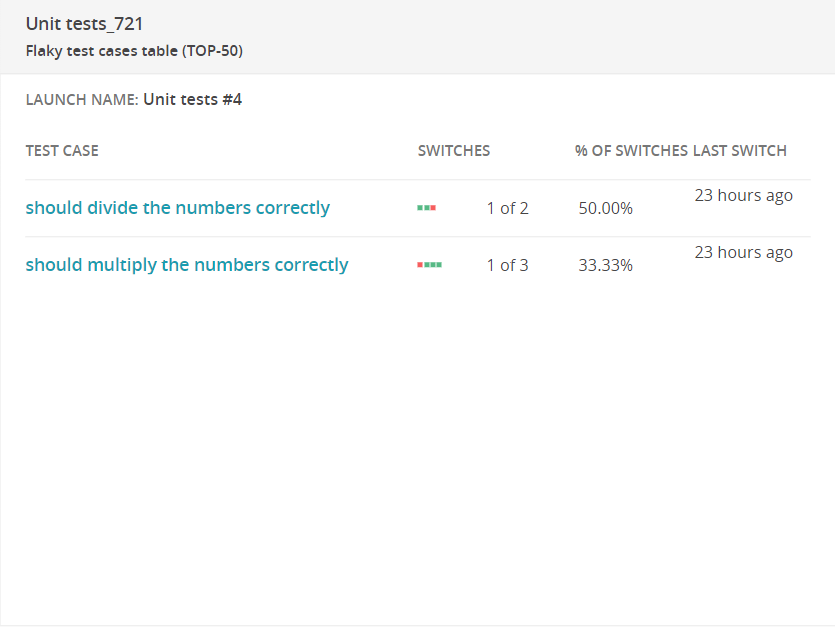
Flaky test cases table This widget is useful for pinpointing unstable autotests that yield different statuses with each execution. Next, we need to consider: could the issue be with the autotest rather than the product itself? It is recommended to pay attention to flaky tests as they affect the stability of the test automation.
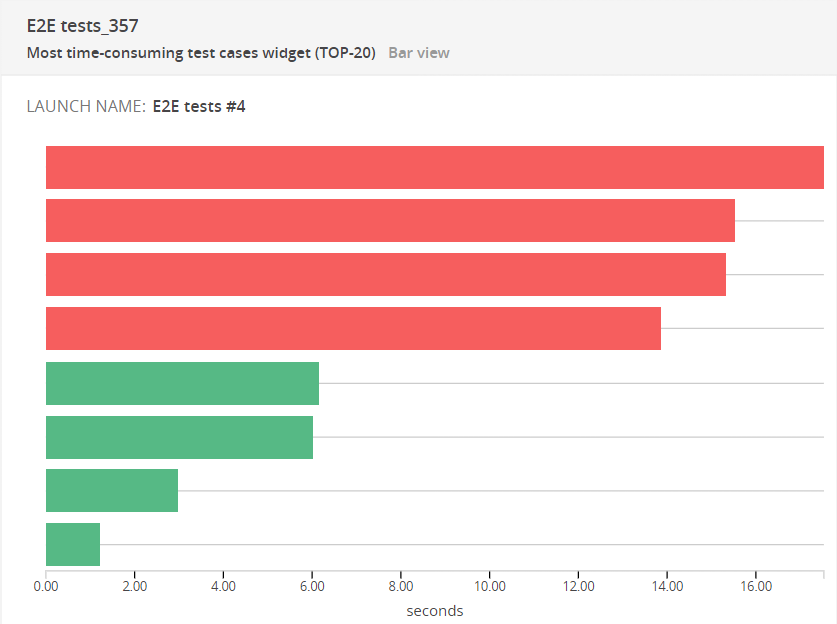
Most time-consuming test cases It's beneficial to use this in conjunction with the Launches duration chart: whenever we notice that a launch is taking an extended amount of time, we can build the Most Time-Consuming Test Cases widget by the name of this launch and identify which test cases are taking the longest and think about their optimization.
Aggregated analytics from several launches
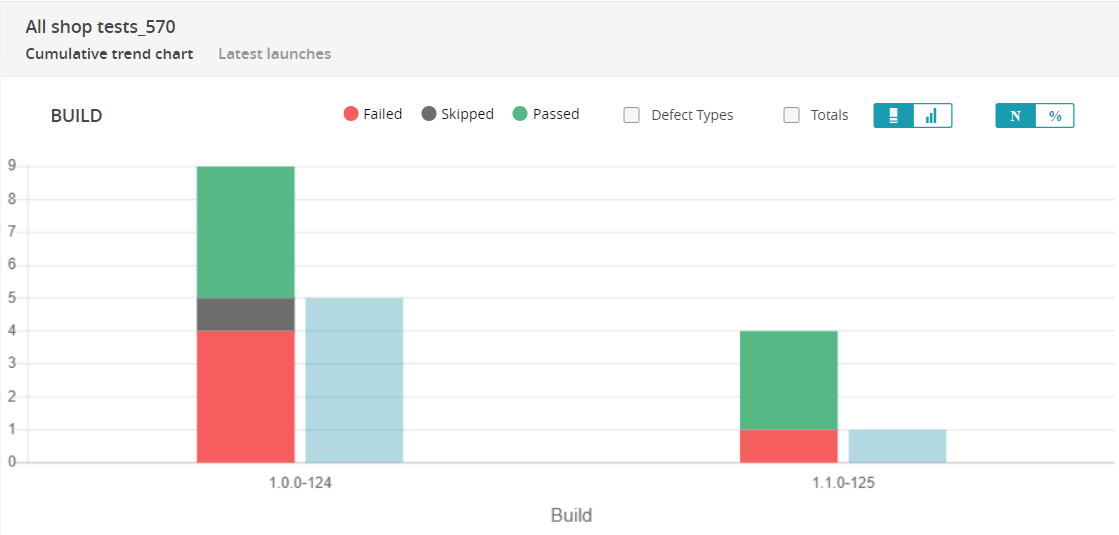
Explore key widgets that provide a comprehensive view of aggregated analytics across multiple launches, offering valuable insights into trends, growth, and overall statistics. Cumulative trend chart You can observe the changes in statistics from one build to another, or from one version to the next. Whenever a new version (build, release, or other) is added to ReportPortal, new data will be incorporated into the graph.
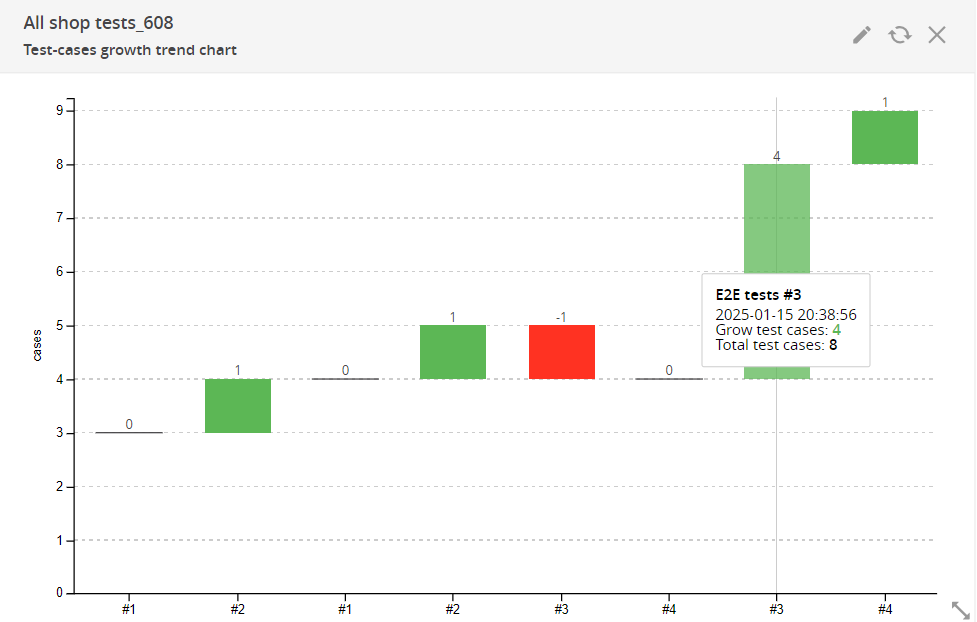
Test-cases growth trend chart This widget can also be valuable for monitoring the overall increase in test cases within a specific launch.
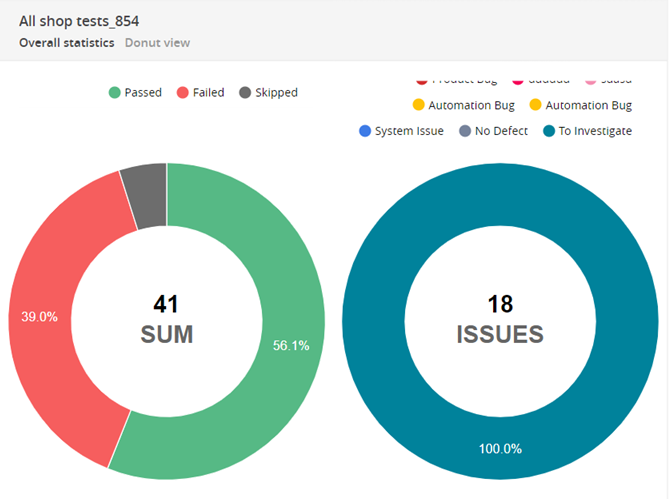
Overall statistics Thanks to this widget, you can look at the distribution of failure reasons.
While this article highlighted 8 essential widgets, ReportPortal offers a total of more than 20 widgets, each designed to cater to specific testing needs. Exploring the full range of widgets will help uncover additional opportunities to optimize test results visualization and streamline decision-making.