ReportPortal is an open-source test automation dashboard designed to collect, analyze, and visualize results from your automated test runs in real time.
It helps QA and DevOps teams focus on what really matters — identifying failures, tracking defects, and improving test stability over time. Getting started with ReportPortal is simple and flexible. Whether you’re experimenting with the demo environment or setting up your own environment, this guide will help you get from installation to actionable insights in just a few steps.
1. Getting started with demo and own environment
1.1. Begin with Demo environment
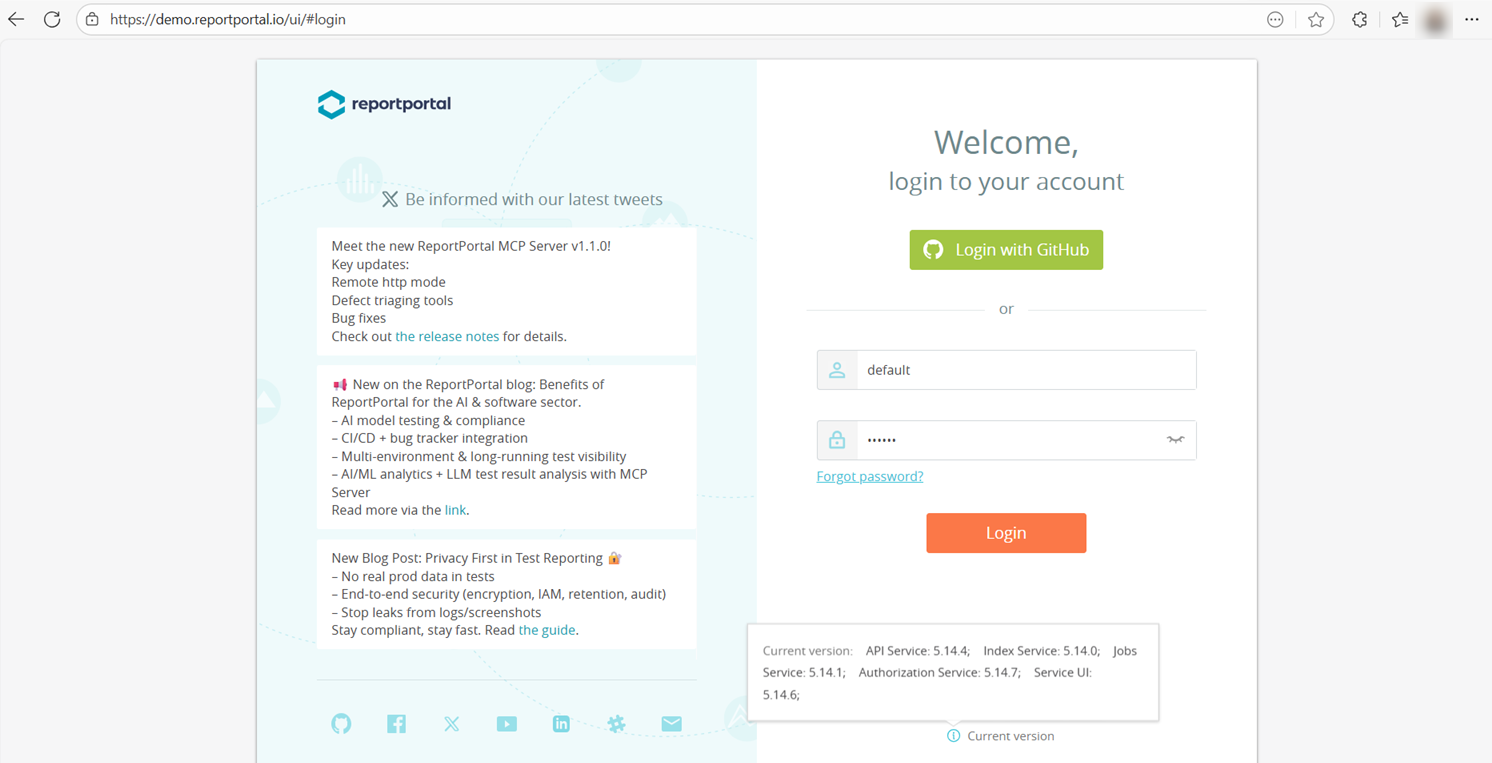
The quickest way to explore ReportPortal requires no setup — just use the Demo Instance. This hosted environment lets you experience all the core features instantly. You can log in with the pre-filled demo credentials to access a shared sample project and see how ReportPortal visualizes test executions in real time:
Login: default Password: 1q2w3e
If you prefer a private space, simply choose "Login with GitHub" — a personal project will be created for you automatically, and only you will see its data.
The demo is free, includes all enterprise-level features, and all data is deleted every 24 hours. It’s the perfect way to evaluate ReportPortal, understand its workflow, and decide whether you want to set up your own instance for production use.
1.2. Install and Run own environment
After trying the demo, you can easily move to a full setup on your machine or server to start collecting your test results.
You can deploy ReportPortal quickly using Docker.
Supported operating systems:
Linux (Ubuntu 20.04+ or equivalent) - Recommended
macOS (Intel or Apple Silicon; Docker Desktop requires macOS 12.0+)
Windows (64-bit Windows 11 Pro+ with Hyper-V/WSL 2)
Before installation, make sure Docker is allocated at least 2 CPUs, 6 GB RAM, and 20 GB of free disk space.
To install and start ReportPortal:
1. Download the latest Docker Compose configuration:
curl -LO https://raw.githubusercontent.com/reportportal/reportportal/master/docker-compose.yml2. Open `docker-compose.yml` file and set a secure admin password under the RP_INITIAL_ADMIN_PASSWORD variable.
3. Deploy using:
docker-compose -p reportportal up -d --force-recreate Once containers are running, open your browser and navigate to:
http://localhost:8080 (if installed locally), or
http://<your-server-ip>:8080 (if hosted remotely).
When the login page shows all core services (API Service, Jobs Service, Authorization Service, Service UI), ReportPortal is ready.

Default credentials:
User: default / 1q2w3e
Admin: superadmin / erebus
For security, change the admin password right after the first login.
2. Integrate with Frameworks
Once you have access to a running ReportPortal instance — whether your own or the demo — the next step is to connect it with your test automation framework so that results can be automatically reported and visualized. ReportPortal works with popular frameworks such as JUnit, TestNG, Pytest, Robot Framework, Cypress, Playwright, NUnit, Reqnroll, and others.
Install the appropriate client agent for your language and provide:
Endpoint: your ReportPortal API URL (e.g., http://localhost:8080/api/v1)
Project name
User API token (from your profile)
Once configured, run your tests as usual — the results will automatically appear as a new Launch inside ReportPortal.
3. Review Test Results
Open the Launches tab to see all test runs. Each launch entry includes its start time, duration, and the number of Total, Passed, Failed, and Skipped tests.
Click a launch name to open its hierarchy: Suite -> Test -> Step -> Log. You can navigate by clicking on names or status counts to filter specific results.
Within the Log view, you’ll find detailed logs and attachments for each test.
As you review your test results and inspect logs, you’ll likely notice some failed or unstable cases. That’s where defect triage comes in — the next step of the process, where you analyze the root cause of each failure and classify it properly. For any failed item, you can assign an appropriate defect type:
To Investigate – not yet reviewed
Product Bug – issue in the application
Automation Bug – problem in the test or data
System Issue – environment failure
No Defect – false alarm or expected outcome
4. Visualize Test Data
After reviewing and triaging your test results, it’s time to turn data into insights.
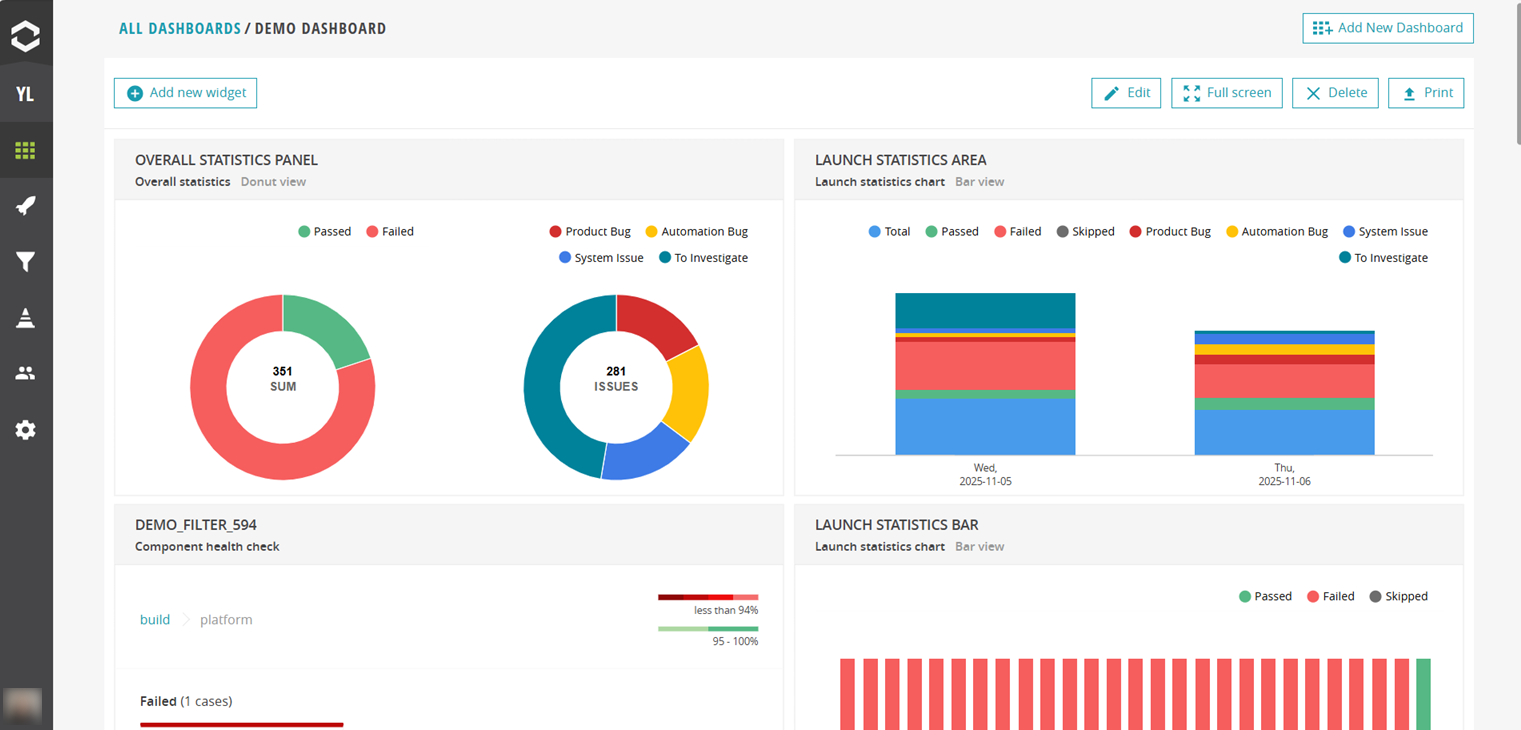
ReportPortal provides rich visualizations to help you track testing trends and quality metrics in real time. Dashboards can include various widgets — such as Overall statistics, Component health check, Passing rate summary, Flaky test cases table — giving you instant visibility into your automation performance. To quickly build a dashboard tailored to your own test data:
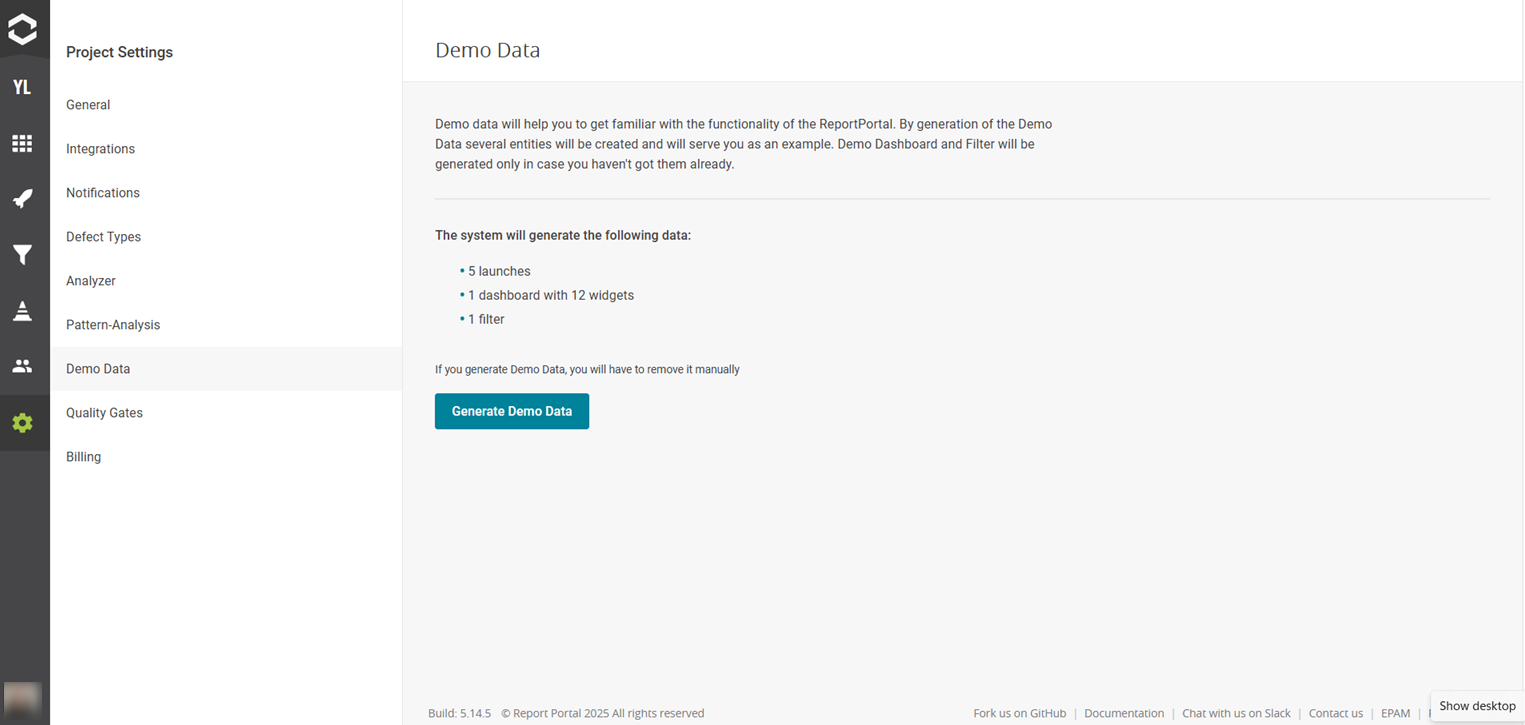
Generate demo data This initializes the dashboard with preconfigured widgets.
![Generate demo data]()
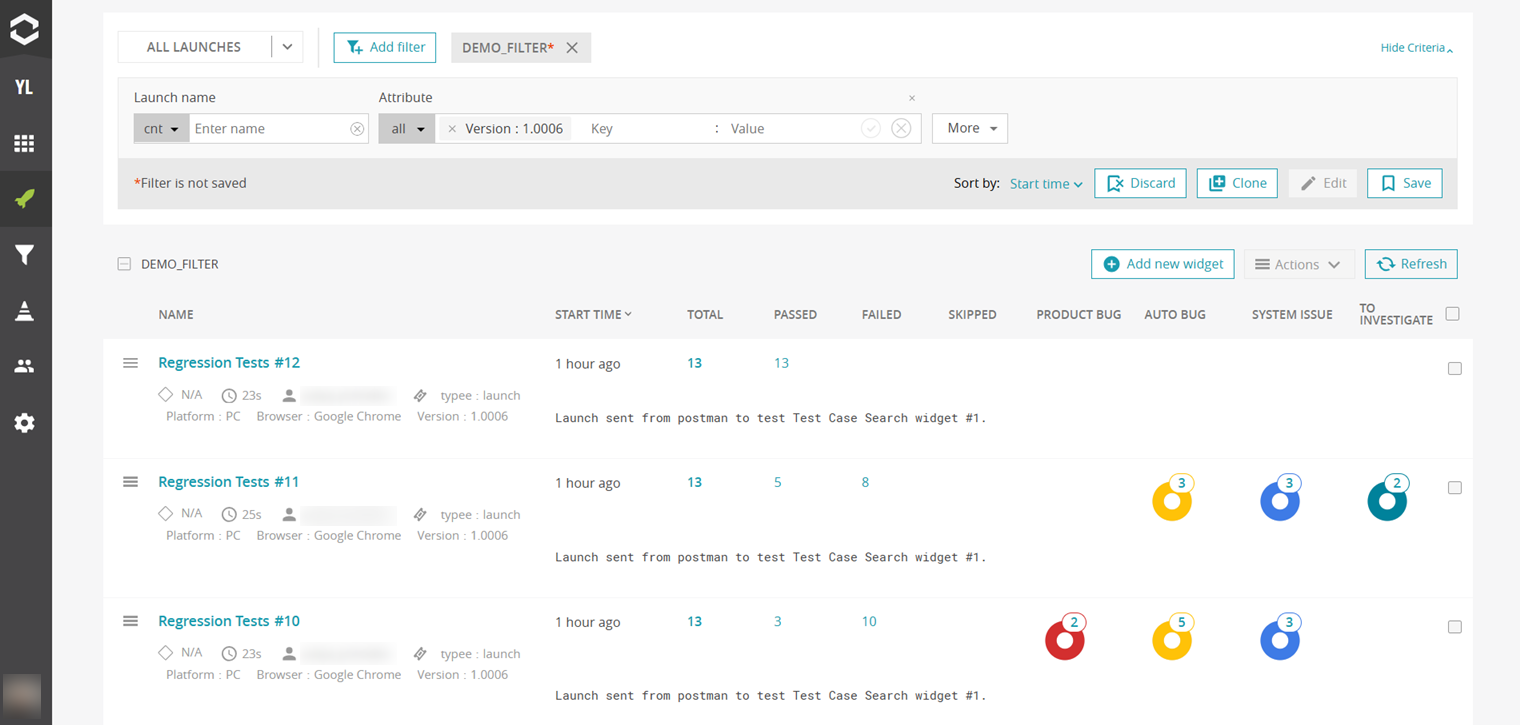
Edit the demo filter Update it to include your launch name or attribute.
![Edit demo filter]()
Once you save the changes, the demo dashboard will automatically refresh, and all widgets will display metrics based on your actual test runs.

This quick start guide has shown how easily you can begin working with ReportPortal — from exploring the demo environment to deploying your own instance, integrating it with your test framework, reviewing results, and visualizing key metrics. With just a few steps, you can turn raw test execution data into clear, actionable information about product quality and test stability. Whether you’re running small regression suites or managing large-scale CI pipelines, ReportPortal helps you centralize results, speed up failure analysis, and make data-driven decisions for continuous improvement in testing.

